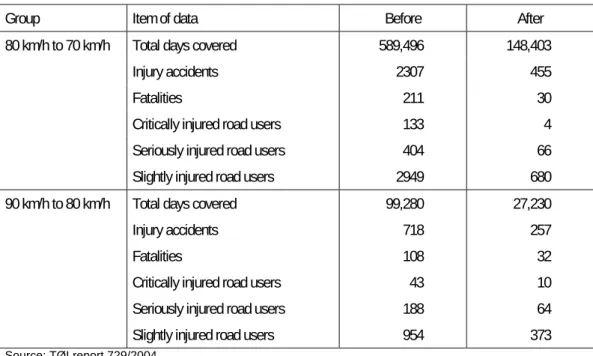
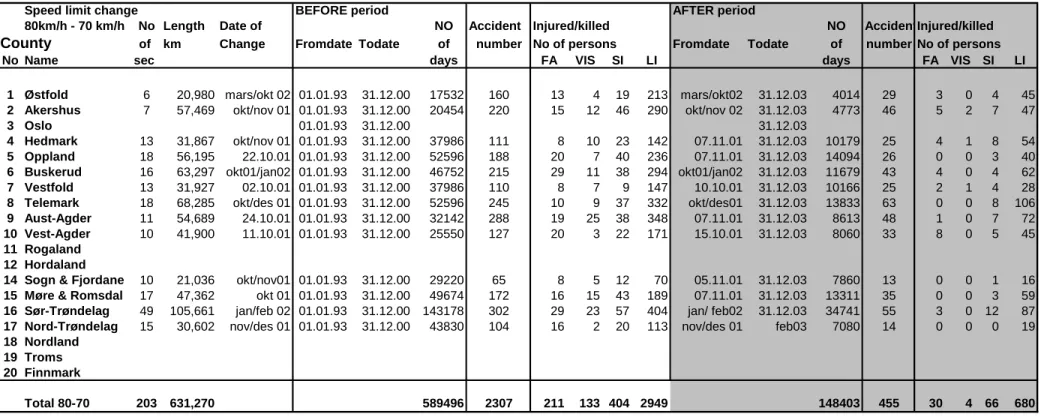
På veier hvor fartsgrensen er satt ned fra 80 km/t til 70 km/t er det en nedgang både i antall ulykker og antall skadde trafikanter. Alle veier med fartsgrense 80 km/t (eller 90 km/t) som har forventet skadeprosent i sikkerhetsklasse 4 eller 5 (dvs. FSGT høyere enn 1,65) og som samtidig har registrert skadeprosent i sikkerhetsklasse 3, 4 eller 5 (dvs. RSGT over 1.30) må reduseres fra 80 km/t til 70 km/t (alternativt fra 90 km/t til 80 km/t). Antall drepte (DR) og alvorlig skadde (HS= MAS+AS) utgjør 748 i førperioden og 100 i etterperioden på strekningene avgrenset fra 80 km/t til 70 km/t.
Nedre del av tabellen viser regresjonseffektene for veier hvor fartsgrensen er endret fra 90 km/t til 80 km/t. Uavhengig av hvilket referansevegnett som velges, er de beregnede nettovirkningene negative på vegnettet der fartsgrensen endres fra 80 km/t til 70 km/t. De beregnede nettovirkningene viser en økning i antall ulykker på veinettet der fartsgrensen er endret fra 90 km/t til 80 km/t.

Introduction
The report structure
2 Copyright © Transporteconomics Institute, 2005 This publication is protected under the Norwegian Copyright Act of 1961.
Speed limit reduction criteria
4 Copyright © Institute of Transport Economics, 2005 This publication is protected in accordance with the Norwegian Copyright Act of 1961. In other words, this implies that the criteria for lowering the speed limits from 90 km/h to 80 km/h and from 80 km/h up to 70 km/h difference.
Road sections with lowered speed limits
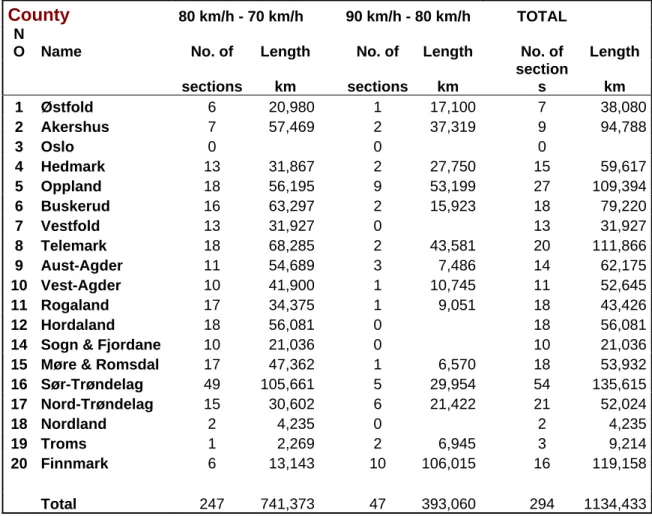
Speed limits were lowered on a total of 294 stretches on the national and European road network with a total length of 1134 km. The table contains the road sections with reduced speed limits reported by the regions to this project. It cannot be excluded that there are sections with lower speed limits than those shown in table 1, but these are not part of this study.
6 Copyright © Institute of Transport Economics, 2005 This publication is protected in accordance with the Norwegian Copyright Act of 1961.
Method
Before-and-after study
Regression-to-the-mean
Averaging normal and recorded numbers is done using the method presented in the aforementioned report. The difference between the expected and recorded number of injuries and accidents is considered regression to the mean. This method was used to correct the number of injuries and accidents in the previous period for regression to the mean.
There is no reason to expect the speed in the pre-period to be unusually high in the same way as the number of injuries and accidents. This means that the velocity data from the before situation should not be corrected for any regression-to-the-mean.
Comparison sections
8 Copyright © Institute of Transport Economics, 2005 This publication is protected under the Norwegian Copyright Act 1961.
Effect on driving speeds
Study approach
This is done because it is assumed that measuring equipment malfunctions during this hour or that other conditions (roadworks, accidents, congestion or other obstacles) slow down traffic to an extent where the speed limit has no effect on travel speeds. Additionally, the program eliminates all hourly speeds with a standard deviation greater than normal (>20km/h). When comparing a "typical" Monday in the pre-period with Easter Monday in the post-period, it cannot be claimed that any speed changes from the pre-period to the post-period were caused solely by speed limit changes.
Data from 16 treated roads
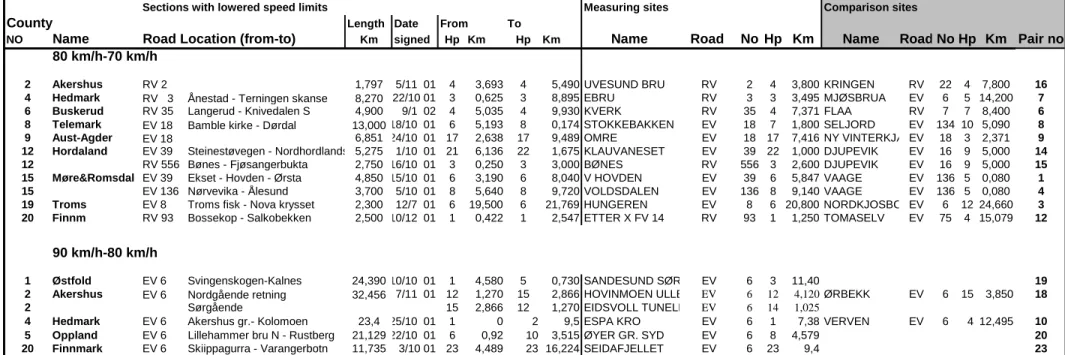
Sections with reduced speed limits, length in km, the time of speed limit reduction, potential measurement sites on sections with speed limit reduction and corresponding comparison sites. The upper part of the table shows areas where the speed limit is changed from 80 km/h to 70 km/h, while the lower part concerns 90 km/h to 80 km/h. The table shows that the data material for the evaluation of speed limit changes from 80 km/h to 70 km/h includes eleven data pairs, each consisting of treatment and comparison sites (22 measurement sites in total).
Correspondingly, the table shows that data for the 90 km/h to 80 km/h sections consists of two data pairs with both treatment and comparison sites, as well as three treatment sites for which it has not been possible to find suitable comparison sites. (a total of seven measuring points). In total, at the 16 treatment and 13 comparison sites, speed measurements were made for more than 97710 hours with more than 57 million passing vehicles. Number of speed measurements before and after speed changes at treatment and comparison sites and in total.
With such a large amount of data for both the pre- and post-periods, even very small changes (0.2 km/h) in average speed will be statistically significant. However, there will always be differences between the before and after periods that cannot be fully controlled. This means that there could easily be statistical differences between the before and after periods without being caused by the speed limit changes.
But also between comparison sites and treatment sites there may be differences that cannot be controlled, which may affect the results in various ways. The greater the change, the more likely it is that the effect will be due to the speed limit change.
Results (driving speeds)
Number of hours recorded, number of vehicles observed, driving speeds before and after speed limit change (km/h). At the comparison sites, driving speed also changed from the before to the after period. As the treatment sites did not have specific comparison sites (comparison sites specifically matched to each treatment site), it is difficult to estimate the exact net effect of the speed limit change, site pair by site pair.
The measured speed change effect from 80 km/h to 70 km/h at all treatment locations is –4.1 km/h. This uncertainty is dealt with by concluding that the speed change resulting from the change of the maximum speed from 80 km/h to 70 km/h is between –4.1 km/h and –2.1 km/h. Where the speed limit was changed from 90 km/h to 80 km/h, the vehicle speed change was measured at –2.8 km/h.
The measured average speed in the pre-situation is 85.1 km/h compared to 82.2 km/h in the post-situation. The location with the modest speed change of -0.8 km/h is particularly remote with high driving speeds in both the pre- and post-period. The same reasoning and problems surrounding the use of comparison sites also played a role in the change of the speed limit from 90 to 80 km/h.
When these results are interpreted analogously to the change from 80 km/h to 70 km/h, it means that the speed change due to the speed limit change from 90 km/h to 80 km/h is between –2.8 km /h and – 1.6 km/h. Number of observation hours, number of registered vehicles, driving speeds before and after speed limit change (km/h).

Effect on injuries and accidents
Study approach (injuries and accidents)
16 Copyright © Institute of Transport Economics, 2005 This publication is protected in accordance with the Norwegian Copyright Act of 1961.
Available data (injuries and accidents)
- Sections with a reduced speed limit, treated sections
- Comparison sections
The lower part of Table 10 shows the estimated total regression-to-mean value for the stretches where the speed limit was changed from 90 km/h to 80 km/h. The net effect for fatalities and serious injuries (FA+SEI) from a change in the speed limit from 80 km/h to 70 km/h, based on comparison network I, is estimated at –35.1%. Both the estimated gross effects and the net effects show an increase in the number of accidents on the road network where the speed limit changes from 90 km/h to 80 km/h.
The estimated regression on the mean of the change in speed limit from 80 km/h to 70 km/h for injuries and accidents seems reasonable. Adjusted for this regression to the mean, the overall gross effect of the change in speed limit from 80 km/h to 70 km/h for fatalities and serious injuries is estimated to be -34.5%. Based on the comparison network I, the net effect on accidents due to the change in speed limit from 80 km/h to 70 km/h (also adjusted for regression to the mean) is estimated at -15.5%.
The speed limit reduction from 90 km/h to 80 km/h led to a reduction in driving speed of 2.8 km/h (gross effect). The speed evaluation comparison sections, similar to the 80 km/h to 70 km/h speed limit change, have some weaknesses. The effect on the number of accidents and injuries of the 90 km/h to 80 km/h speed limit reduction can at most be considered unresolved and difficult to interpret.
The estimated regression to the mean for this speed limit change, similar to the 80 km/h to 70 km/h, seems reasonable. The effect of the reduction of the maximum speed from 90 to 80 km/h on the different injury severity is significantly different for the two comparison networks.
Results (injuries and accidents)
- Gross effects
- Regression-to-the-mean
- Comparison sections
- Summary and estimation of net effects
Discussion and conclusions
Speed limit change from 80 km/h to 70 km/h
The quality of the comparison sections for speed evaluation is discussed and commented on in section 4.3. The comparison sections are not considered ideal, but are still given some weight. Since stretches that must have reduced speed limits are selected taking into account the number of accidents and injuries, assessing the effect on accidents and injuries requires that the number of injured and accidents in the before situation be adjusted for regression-to-the-mean.
The two comparison networks needed to estimate the net effects for injuries and crashes produce different results from before the speed limit change. However, the difference between the two networks is not very large, although some attention to the difference in the estimated change in the number of fatalities is warranted. For comparison I, the number of people killed increased by +27.3%, while the figure for comparison II is -0.9%.
In the network with an unchanged speed of 80 km/h, the number of victims has increased by 27.3%, while in the entire network, regardless of the speed limit, there is no change. The arguments for choosing comparison I are based on the fact that this network is more similar to the reduced speed limit sections (80 km/h to 70 km/h) than comparison II. However, it could be argued that comparison I, which consists of nearly 12,000 km of road, should be adequate to use as a benchmark and that it is this comparison that best caters for the distinctiveness of the 80 km speed limit network. /h. .
Speed limit change from 90 km/h to 80 km/h
30 Copyright © Institute of Transport Economics, 2005 This publication is protected in accordance with the Norwegian Copyright Act of 1961.