Creative and cultural industries are important generators of intellectual property, especially copyright. Further statistical work is needed to measure the true size of the creative and cultural industries.
2 Principal labour markets
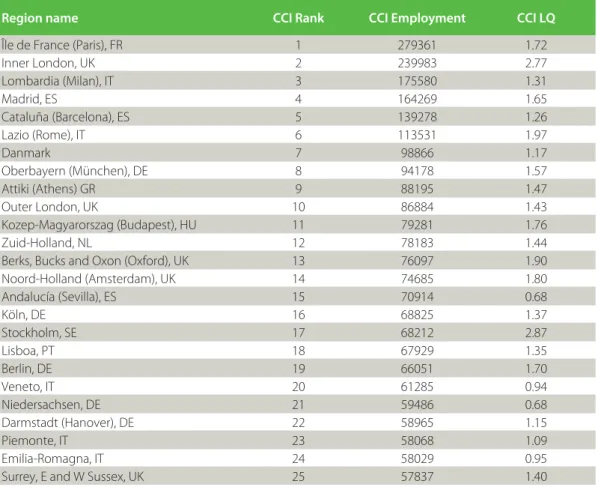
Regions that rank in the top 25, either by regional population size or creative and cultural industries employment. Among the regions of Europe that count among the top 25, either by population or CCI employment, the following cities host an over-representation of the creative and cultural sector: Amsterdam (North Holland), Berlin, Frankfurt (Darmstadt), Brighton (Surrey , E and W Sussex), Budapest (Kozep-Magyarorszag), The Hague (Zuid-Holland), Lisbon, Inner London, Oxford (Berks, Bucks and Oxon), and Stockholm.

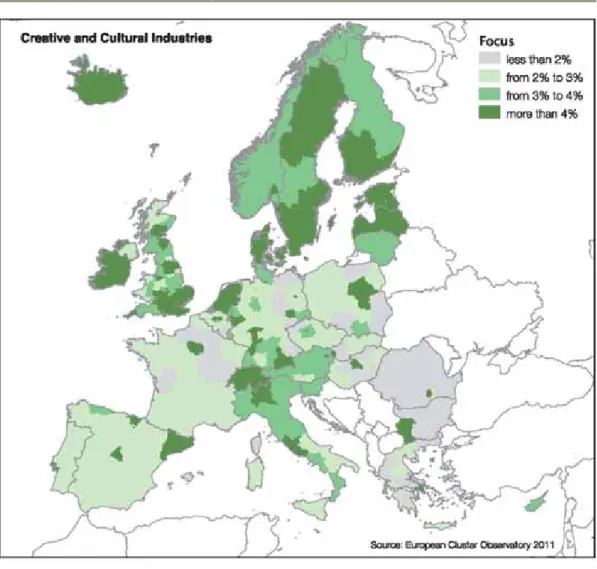
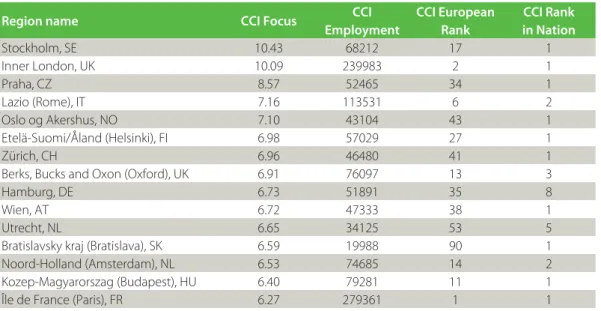
3 Regional specialisation and focus
Of the top 15 CCI focus regions, three are in Central and Eastern Europe: Prague, Bratislava and Budapest. Despite being only the 223rd most populous region in our survey, Bratislava is a region where the creative and cultural industries account for an unusually high share of regional employment, and also ranks 12th in Europe according to CCI LQ and CCI Focus.
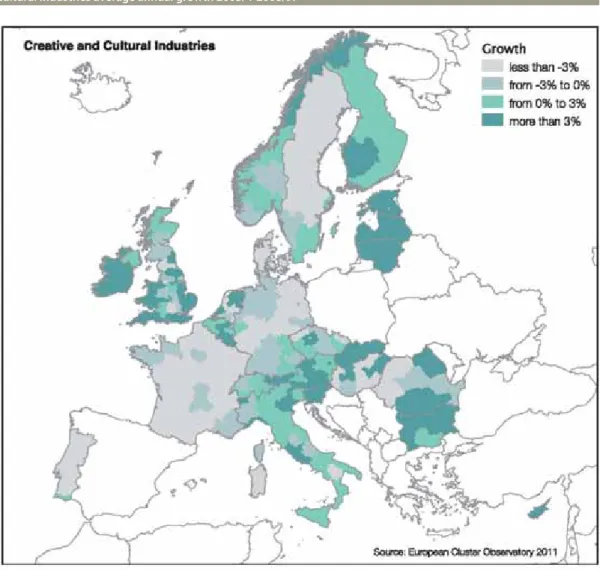
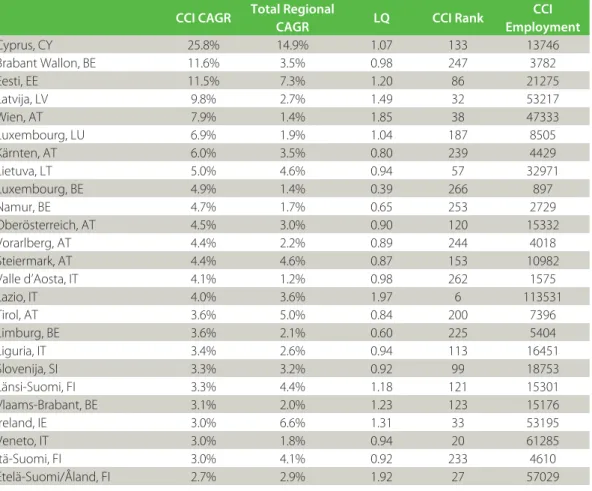
4 Growth
LQ is an indicator of CCI employment relative to total employment in the region, where LQ>1 means an overrepresentation of CCI employment. Strikingly, 15 of the 25 fastest growing regions were in Austria, Belgium or Italy. Most of the regions in the first 25 regions with the highest cultural and creative growth are small and medium-sized regions.
Many of the fastest growing regions are relatively small and growing from a lower-than-average starting point: 15 of the 25 fastest-growing regions have a CCI share of regional employment below or well below the European region average. One possible explanation, for which there is some evidence, is that CCI growth/decline is linked to cycles in the rest of the regional labor market, and that the CCI will rise where there is growth and fall where there is a general decline. This would mean that the creative and cultural industries are embedded and interdependent with the surrounding economy; but not independent of the region, as may be fully export-oriented industries.
Regionalized patterns of growth and change appear to be a strong feature of the creative and cultural industries.
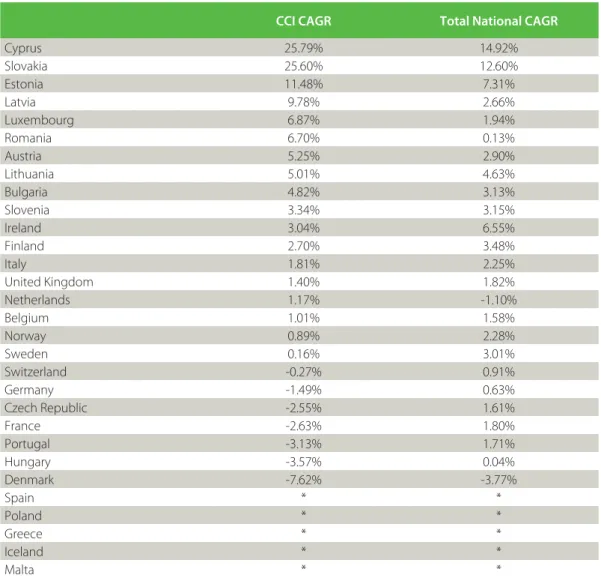
5 National perspectives on growth and size
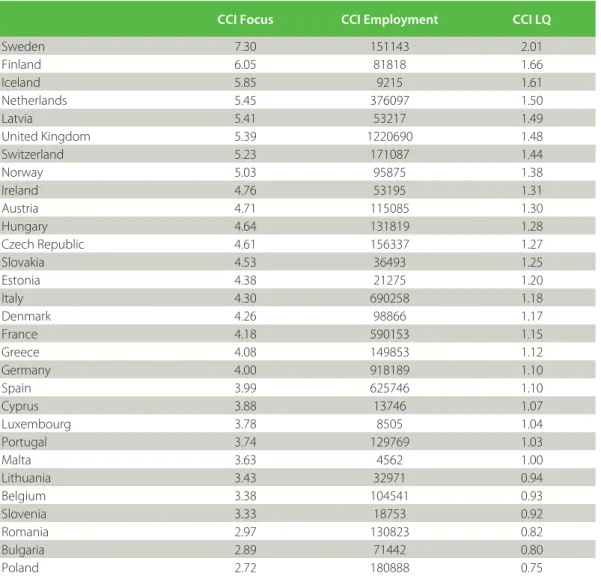
Average annual growth in employment in creative and cultural industries and in all sectors of the economy. As shown in Table 6, only two of the 10 countries with the highest CCI focus have populations above 10 million: the Netherlands and Great Britain. The lower share of total employment accounted for by CCI in larger countries may be due to the ability to exploit greater economies of scale in the provision of creative and cultural products.
It may also be that smaller countries with their own language, cultural heritage and specific urban finds find it more difficult to import substitutes or require more labor to adapt to local conditions and requirements. Note: the focus indicates how large a share of total employment in the country is represented by the CCI sector. LQ is an indicator of CCI employment relative to total employment in the region, where LQ>1 indicates an overrepresentation of CCI employment.
For example, while Romania has one of the lowest shares of its total employment in creative and cultural industries, as a nation it ranks 14th in Europe and the capital of Bucharest ranks 31st among all European regions, while it is home to 42 % of the country's creative and cultural industries employees.
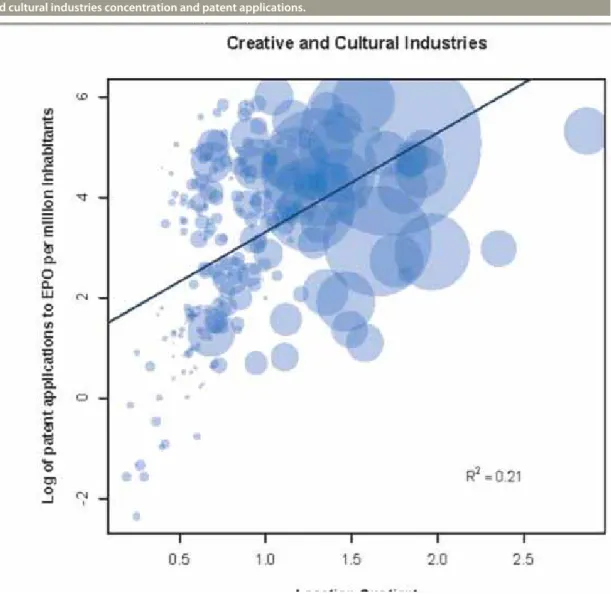
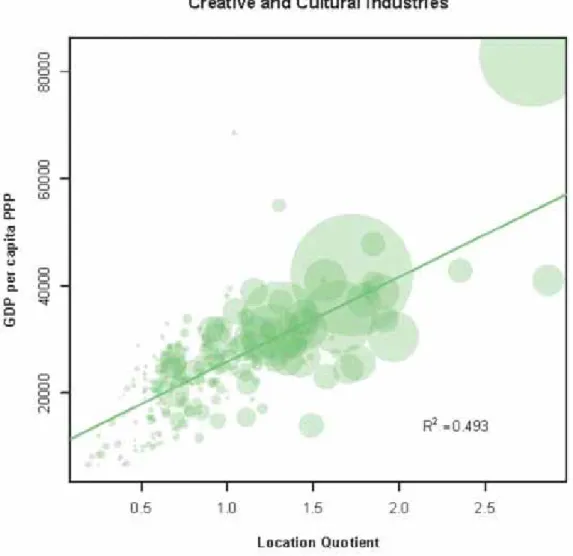
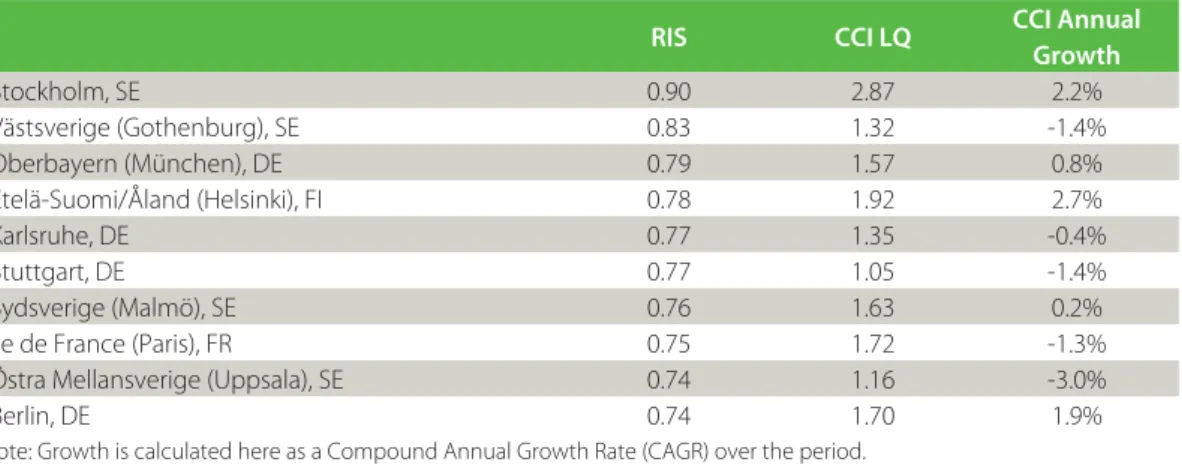
6 Innovation
However, those regions with the highest RIS rankings are evenly split between regions with positive and negative creative and cultural industries employment growth. Many of the types of knowledge, goods, services and business models produced by the creative and cultural industries simply cannot be protected by patents. Other types of intellectual property appropriation and exploitation regimes are much more central to the creative and cultural industries.
In particular, copyright is a more common form of intellectual property appropriation in creative and cultural industries than patent. Regional innovation measures tend to emphasize a region's emphasis on science and high technology and it is not clear that all the creative and cultural industries are reliant on such types of 'innovation' systems to sustain their own creativity and innovation. Nevertheless, all the regions in the top 10 of the regional innovation scoreboard were home to an over-representation of creative and cultural industries.
Innovation performance indicators better tuned to the innovation dynamics (and likely spillover areas) of the creative and cultural industries are needed to draw more definitive conclusions about their impact on and role in regional innovation.
7 Breaking down the creative and cultural industries
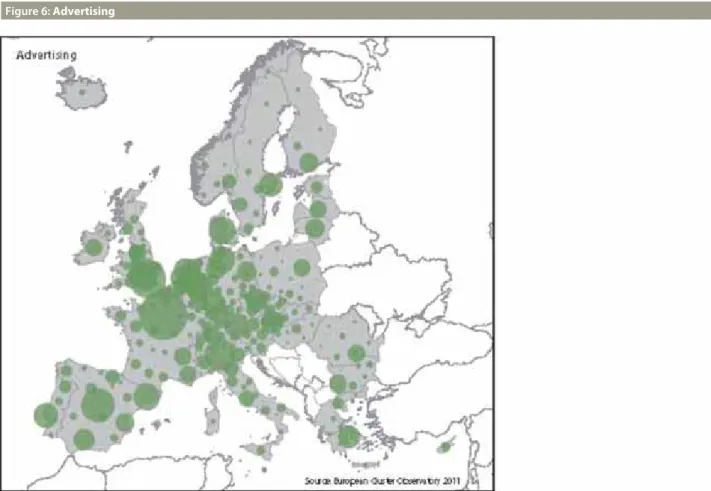
The table below lists the top 10 clusters (defined by employment and share of total European employment in this category) in the 6 fields shown above: artistic creation and literary creation; Advertising; Design activities;. These figures clearly show the role of Paris, London, Milan, Madrid, Barcelona and Rome as the most important European employment centers for the creative and cultural industries.
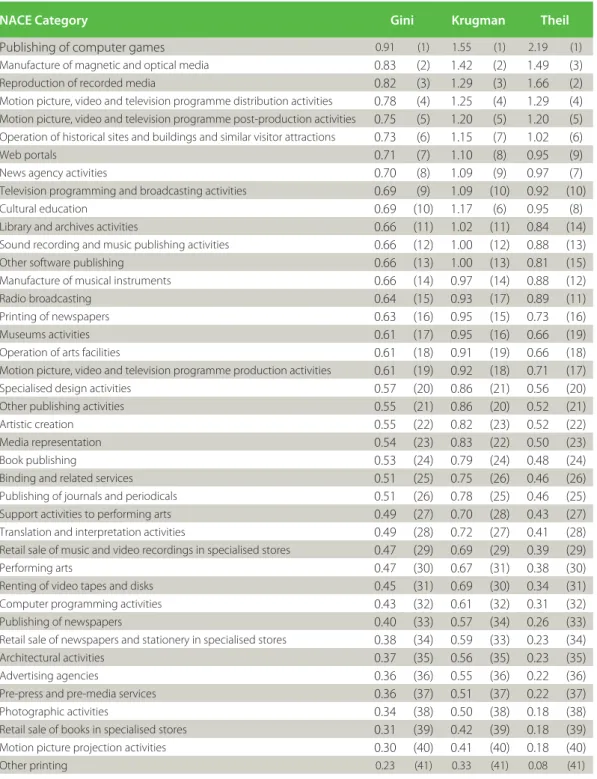
8 Clustering and value chains
The least concentrated activities are those in the value chain that are closest to the consumer - such as bookstores, cinemas and exhibition spaces - or are business services/inputs that the creative and cultural industries regularly need - such as printing, programming, photography, or pre-press/ pre-media services. There is also evidence to suggest that sub-sectors of the creative and cultural industries have a tendency to co-locate or cluster closely together. In other words, subsectors of these industries are not equally attracted to each other: some subsectors are more likely to co-localize than others.
It can be seen that the strongest trend for co-location is between the advertising industry and game publishing. Advertising and radio and television activities are also likely to be co-located in the same regions. The design also shows a tendency to co-locate with advertising, and to a lesser extent with game publishing.
Artistic and literary creation workers tend to be over-represented in regions where radio and television activities are also over-represented.
Co nceptual defi nition
Concepts such as 'cultural industries', 'copyright industries' and 'content industries' usually define industries for inclusion in terms of their main outputs or key products. Concepts such as 'creative industries' define industries for inclusion based on the types of inputs and generative processes that characterize their core value creation. It is also fair to say that, despite the differences, there is considerable overlap when we think about which industries are involved in creative and cultural outputs and those that deal with creative inputs and processes.
Indeed, given the policy and academic debates in this area, it is practical to speak of the "creative and cultural industries". For the purposes of this report we use the following definition of creative and cultural industries: those concerned with the creation and provision of marketable products (goods, services and activities) that depend on creative and cultural inputs for their value. Inspired by the work of Michael Porter (Porter 1990) we include not only the primary creative or cultural talent, but also the wider supporting and related industries that are essential to the commercialization of creative and cultural products.
As this report focuses on clusters and competition in the creative and cultural industries, we use an industrial systems approach and do not focus solely on the act of creation itself.
Statistical d efi nition
Singapore, Creative Industries Strategy Group Ministry of Information, Communications and the Arts, Economics Division Ministry of Trade and Industry. The Nordic 'Cultural Industries': A Cross-National Assessment of the Place of the Cultural Industries in Denmark, Finland, Norway and Sweden." Geografi ska Annaler B Culture and Creative Industries in Germany 2009 Monitoring Selected Economic Key Data on Culture and Creative Industries – Monitoring Report 2010 – Summary Version Final Report: Culture and Creative Industries in Germany Defines the general characteristics of the heterogeneous core branches of the "cultural industries" from a macroeconomic perspective.
The preliminary results and methodology were presented at the expert workshop entitled "Towards a pan-European initiative to support innovative creative industries in Europe", organized by the European Commission's Directorate-General for Business and Industry in collaboration with Amsterdam City, European Design Center, Association of Dutch Designers and IIP Create in Amsterdam, 4.-5. February 2010. We agree that architecture as a service industry is undoubtedly a core part of the creative and cultural industries, but the code in this revision of NACE covers architecture as well as a wide range of engineering and construction businesses. The 2 definition outlined above is similar in many respects to other prominent statistical operationalizations of the concept of cultural and creative industries.
For example, 47.78 contains many actors involved in the art market, which is why the German method includes a percentage of the activities in this code.
D ata
For example, our definition compared to the definition of the German Federal Ministry of Economics and Technology (developed by Michael Soendermann1) includes some categories that they exclude. Furthermore, the German definition, as it is specifically designed for the analysis of a country, may include codes and parts of codes that are difficult in the context of international statistics: 16.29 (Manufacture of other wood products); 23.13 (Production of empty glass); 23.19 (Manufacturing and processing of other glass); 23.41 (Manufacture of household and decorative ceramic articles); 32.12 (Manufacture of jewellery); 32.40 (Manufacturing of games and toys); 47.78 (Other retail trade of new goods in specialized stores); 58.12 (Publication of directories and mailing lists). It is therefore important to understand that: different operationalizations of similar conceptual terms can generate very different figures; the methods by which data are handled and filtered have crucial implications.
For these reasons, we have decided to be cautious in the operational definition used in this report and to avoid including codes where significant levels of proportional and additional data filtering are required. Switzerland Swiss Federal Statistical Office Switzerland Swiss Business Census 4 UK Department for Enterprise, Trade and Innovation. Data on employment in the EU are collected from two different sources: the Labor Force Survey (LFS) and the Structural Business Statistics (SBS), both managed by Eurostat.
In many cases, more detailed data was obtained from National Statistical Offices, but Eurostat remains the main source for the Czech Republic, Hungary, the Netherlands, Romania and Slovakia as well as non-manufacturing sectors in Spain.
In dustry splitting algorithm
Reg ional Units and Aggregation
Ref erences
About the European Cluster Observatory
Europe INNOVA Papers
HOW TO OBTAIN EU PUBLICATIONS
Enterprise & Industry Magazine