Therefore, we depend on a shared understanding of the clients regarding the rationale of the method used and that the results create value. To further facilitate active ownership of the process, a multi-stakeholder development assistance reference group was established in 2009.
Objective and limitations
Purpose
Objective
Key limitations
Conclusions
Negative developments in 2010 reminded the oil industry of the potential risk associated with well control events. The noise exposure indicator shows an improvement in 2011 and several position categories have a positive trend over the last 2-3 years.
Implementation
- Implementation of the work
- Use of risk indicators
- Trends in activity level
- Documentation
A major accident is an accident caused by the failure of one or more of the system's integral safety and preparedness barriers. In the light of the definition of major accidents in the Seveso II Directive, the definition used here is closer to that of a 'major accident'.
Scope
Acute Marine Discharges Report – Norwegian Continental Shelf for 2011, will be published in autumn 2012.
Questionnaire survey
In general regarding HSE-related aspects
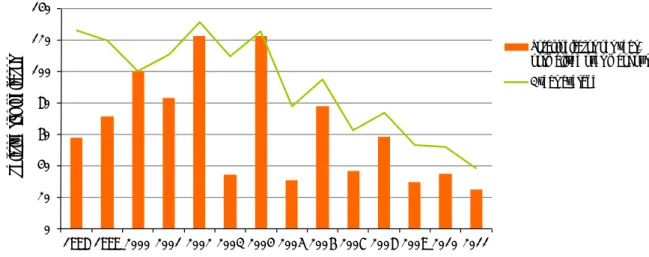
The perception of risk associated with different disaster scenarios increased from 2005 to 2007 and decreased in 2009.
Potential for improvement
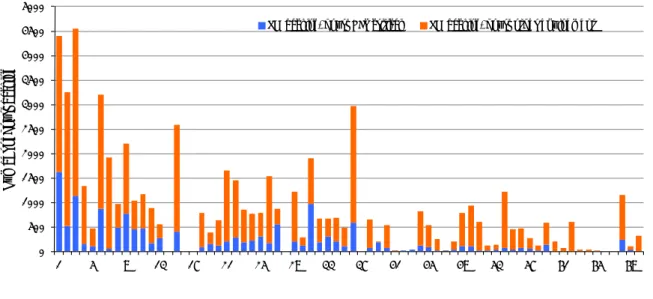
There is a slight reduction in the volume of commuter traffic for the entire period overall. From and including 2000, the number of events was significantly higher than in the period with some variations. There was a decrease in the number of events involving hydrocarbon systems during the period from wells, process systems and pipelines/risers.
Leaks are considered in the main report, normalized by operating hours and number of devices. The division of the areas corresponds to the same division as indicated on the shelf map of the Norwegian Petroleum Directorate. There is wide variation in the number of tests per facility, from daily tests to twice a year.
In recent years, the number of ballast valve failures has been steadily increasing. In recent years, there has been a clear decrease in the number of injuries reported on NAV (Norwegian Labor and Welfare Administration) forms. In the last ten years, there has been a positive development in mobile facilities, as well as in production facilities.
The frequency of injuries in manufacturing plants decreased by 0.25 injuries per million working hours in the last year. The number of chemicals with high risk potential increased by around 27% in the period from 2004 to 2011. During this period, an average of 226 events related to falling objects were reported to the RNNP each year.
The level of the annual number of reported events has been relatively stable over the period, but has fallen slightly in the last three years, to 149 events in 2011.
Causal relations and measures associated with well control incidents in Norwegian
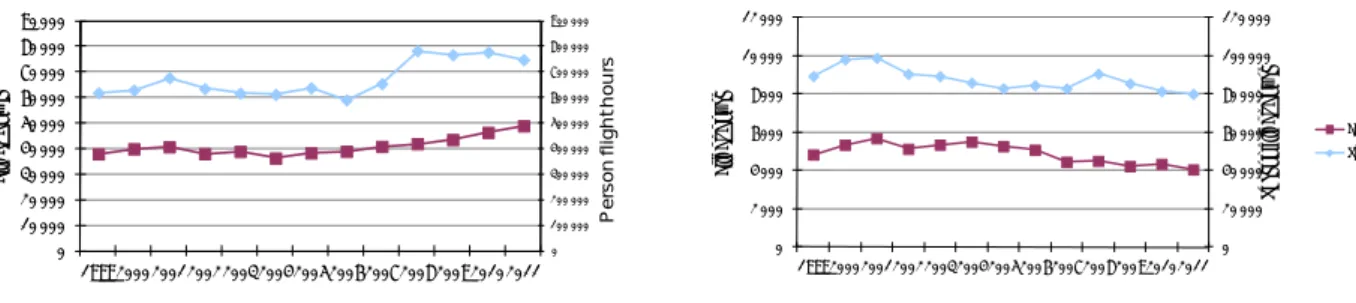
Status and trends – DFU12, helicopter incidents
Activity indicators
Better use of helicopters and the ability of new helicopters to take off with the maximum number of passengers during most weather conditions pulls this in the opposite direction. There was an increase in the percentage of wells in the three main categories from 24 to 27% (62 wells more than in 2009). The calculation of the total indicator also includes cases of serious damage, but with a lower weight than leaks.
There have been no events in the most serious category for the last three years. The differences are even greater if we examine each individual object, which was done for all barrier elements in the Main Report. It is worth noting that only half of the reported data on exposure to chemicals is based on measurements of the pollution of the working atmosphere (measurement data).
In the green area, there is little risk of strain injuries for most employees. The categorization has been made according to model categories developed in the BORA project, see the main report. Category F3 – impact from crash/catch constitutes a relatively large percentage of the incidents in the main category crane-related work processes.

Incident indicators
Status and trends – indicators for major accidents on facilities
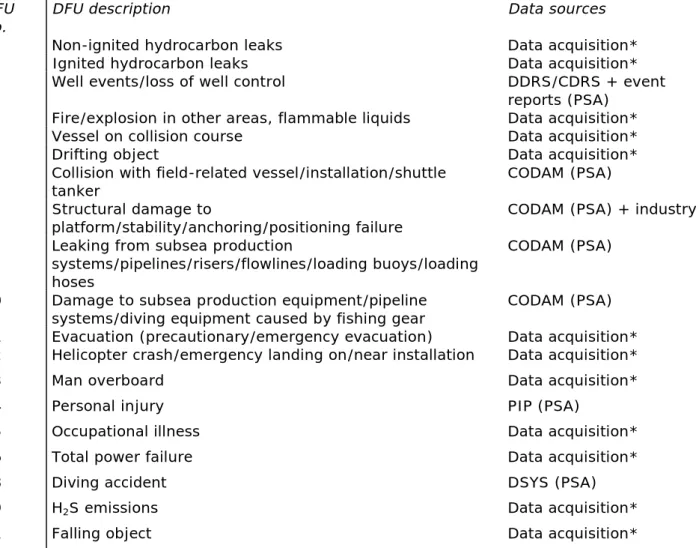
DFUs associated with major accident risk
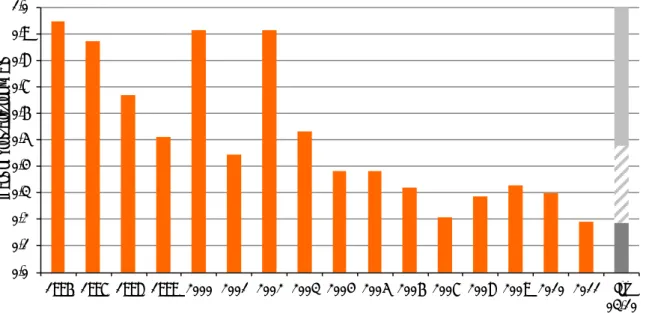
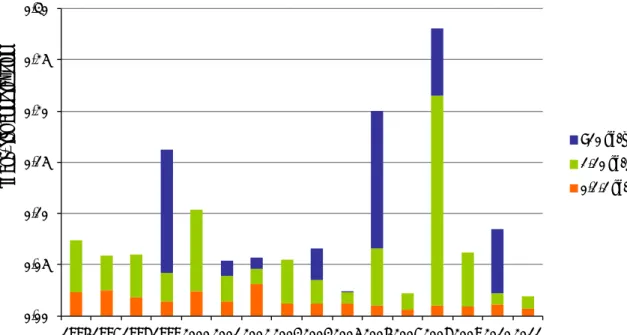
After 2007, no further reductions were found and there were only minor changes around a stable level of approximately 70 events per year. Floating object Ship on articulated path Other fire/explosion Well incident Ign HC leak Unign HC leak.
Risk indicators for major accidents
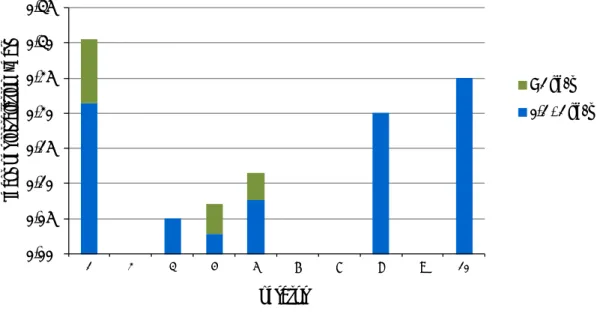
This is illustrated by the fact that the height of the bar for 2011 falls within the middle gray colored field in the bar on the far right of the figure ("Int 03–10", see also sub-chapter 2.3.5 in the pilot project report). This is also underlined by Figure 12 which shows the average leak frequency per facility year for the operating companies on the Norwegian Continental Shelf. The same companies still have the highest frequencies, but they are no longer much higher than any of the other companies.
No burning hydrocarbon leaks (> 0.1 kg/s) have been recorded on the Norwegian continental shelf since 1992. The number of burning leaks has been proven to be significantly lower on the British continental shelf, where approx. The map shows an overview of the well categorization, divided by the percentage of the total selection of 1757 wells.
The results show that in 2010) of the boreholes have reduced quality in relation to the requirement for two barriers (red + orange category). A lifeboat was damaged and destroyed, a below-deck scaffolding was hit and fell into the sea, and aerials on the vessel were damaged. There is no clear correlation between the age of the plant and the number of cracks.
Total indicator for major accidents
Structural damage and events included in RNNP are primarily classified as fatigue damage, but some of this is storm damage. A total of ten cases of structural damage were recorded in 2011, four of which related to anchor lines and four to cracks in the main supporting structures. For mobile facilities, these events are the largest contributor to the overall risk indicator for 2011, at almost 60%.
Status and trends – barriers against major accidents
Barriers in production and process facilities
The industry requirement for an ESDV closure test is 0.01, and the figure shows that several facilities exceed the industry requirement, eight for the fraction of failure in 2011 and 19 for the average value. Overall, many individual facilities as well as various barrier elements performed below or significantly below operating requirements, both in 2011 and averaged over the period. With the industry's current focus on preventing major accidents, one would expect that it would be possible to achieve more improvements in this area than the data of recent years indicates.
The table shows that, overall, most barrier elements are below or almost meet the industry's requirements for accessibility. However, this does not apply to the riser's ESDV and pressure relief valve (BDV), where the total proportion of failures significantly exceeds the industry requirement for 2011 and for the period 2002-2011.

Barriers related to maritime systems
Metacenter height (GM) data for floating production facilities has been collected since 2010, while such data has been requested for mobile facilities since 2008. The facility is stable if the metacentric height is positive and unstable if it is negative. This value primarily expresses the weight changes on the facility, but also whether any changes have been made to the upside volumes.
The average metacenter height on 31 December 2011 was 3.25m for mobile facilities and 3.3m for floating production facilities.
Indicators for maintenance management
There is also a lot of planned maintenance that has not been carried out, also for HSE critical systems and equipment. Therefore, it is important to carry out strict inspections of the delay and the risk it represents. In terms of equipment labeling and classification, 2011 figures show that more manufacturing facilities have labeled systems and equipment than in 2010.
Status and trends – work accidents with fatalities and serious personal injuries
Serious personal injuries, production facilities
Serious personal injuries, mobile facilities
Comparison of accident statistics between the UK and Norwegian shelves
Risk indicators – noise, chemical working environment and ergonomics
Noise hazardous to hearing
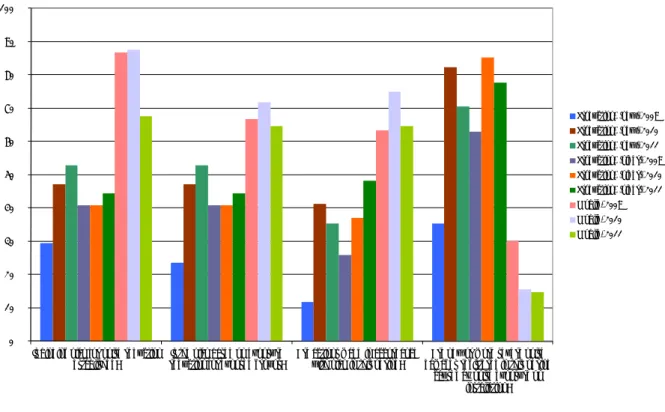
The average noise figure for facilities is significantly influenced by the number of surface treatment personnel who worked at the facility. In general, the development of a noise indicator per workplace category is the best evaluation basis for changes. The noise index for the engineering and surface treatment group is significantly higher than the other groups, and the noise index including hearing protection is still relatively high for these groups.
The report confirms that several companies have formalized and implemented plans for working time restrictions. As in previous years, there is still room for improvement in mobile facilities in this area. Compared to 2010, the picture has developed in a more positive direction for “new” and “old” production facilities.
All in all, it seems clear that large groups of workers in the offshore petroleum activities are exposed to high noise levels and that the. The experience of the PSA through contacts with industry, case management and audits indicates that the potential for noise reduction measures is substantial. This is also one of the reasons why action was taken in 2011 for a major industrial noise reduction project for petroleum activities.
Chemical working environment
Ergonomics
In the yellow zone, there is a certain risk of repetitive strain injury in the short or long term. Otherwise, it is clear that some companies treat the same work tasks quite differently. There are cases where one company reports almost exclusively green and yellow for all job tasks for all job categories, while another company reports a lot of red overall for the same job tasks.
This may reflect actual differences in working conditions, but it may also be due to different assessments of practical conditions. The selection for production plants is not directly comparable with 2010, because data has been reported from more than twice as many plants this year (49) as for 2010 (22). A comparison between production facilities and mobile facilities showed a significantly higher score on mobile facilities for work positions for all workgroups in 2010.
Due to the increase here for manufacturing capacity and the drop for mobile devices, this difference has stabilized. And the mobile performance rating is quite similar to the manufacturing performance rating this year. Hospitality has a higher average rating on land-based facilities, 1.91 compared to 1.76 on the continental shelf.
Other indicators
DFU21 Falling objects
Other DFUs
Definitions and abbreviations
Definitions
Abbreviations