Rapport 1/2022 Vedtak: 2020-5
Industry Concentration and profitability in Europe – the case of Norway
Lars Stemland Eide, Jonas Erraia og Gjermund Grimsby
Prosjektet har mottatt midler fra det
alminnelige prisreguleringsfondet.
Title: Industry concentration and profitability in Europe:
the case of Norway
Abstract
Several recent studies show that market concentration in the US has increased over time, with firm profits increasing in the same period. The consistency of findings from the US is contrasted by more varying results from studies of the development of market concentration in Europe. In this study we utilize the completeness of Norwegian microdata to investigate how methodological choices and data limitations impact results with respect to the market concentration and its relationship with profitability. First, we find that concentration in Norway has decreased slightly over the last two decades. Over the same period profitability has increased slightly for two profitability measures and been stable for the other two. Despite a difference in overall trends, at industry level we find a positive and statistically significant relationship between concentration and profitability for three out of four profitability measures, in line with the market power-hypothesis. Investigating the effect of methodological choices and data limitations, we find that concentration trends are quite robust to exclusion of smaller companies, the incorporation of ownership structures in concentration measures and the choice of industry classification. However, the positive relationship between concentration and profitability is almost non- existent when using readily available industry classification instead of more product market-oriented industry classifications and disappears completely when we do not exclude export-oriented industries. Our study is relevant for future research, as well as for policy makers, as our results indicate that one should be careful when interpreting results from studies of market concentration which fail to handle these methodological challenges.
Authors
Lars Stemland Eide, Jonas Erraia and Gjermund Grimsby
1
List of contents
1. INTRODUCTION 2
2. LITERATURE REVIEW 4
3. DATA 6
3.1. Industry classification 6
3.2. Measures of market concentration 8
3.3. Measures of profitability 9
4. RESULTS 11
4.1. Exclusion of smaller companies 15
4.2. Testing the importance of ownership structures 16
4.3. Testing the importance of industry classifications 19
4.4. Exclusion of export-oriented industries 20
5. CONCLUSIONS 23
6. REFERENCES 25
APPENDIX 27
Appendix A – Industry definitions 27
Appendix B - Robustness tests 43
2
1. Introduction
Modern economics relies on the argument that the free market, given sufficient competition, promotes efficient allocation of resources. Standard oligopoly theory suggests that insufficient competition, captured by increasing market concentration, leads to increasing market power, lower output, and higher prices (see e.g. Cowling and Waterson, 1976). A growing body of research shows that market concentration in the US has increased over time, with firm profits increasing over the same period.1 For example, using Economic Census company-level data, Autor et al. (2020) show that market concentration in the US increased significantly in the period from 1982 to 2012. Measured by 4-digit NACE, 75 percent of all industries saw a rise in market concentration from the global financial crisis (GFC) in 2008-09 to 2012. Moreover, increased market concentration has occurred alongside a general increase in markups, further indicating rising market power over time in the US (De Loecker et al., 2020).
Findings about the trend in market concentration from Europe vary considerably more than those from the US.
While Bajgar et al. (2019) and Valetti et al. (2019) find that market concentration in Europe has increased since the late 1990s, others find that market concentration has been stable or even fallen in recent decades (Gutiérrez and Philippon (2018), IMF (2019), and Cavalleri et al. (2019)). On markups in Europe, the IMF (2019) finds that most EU countries saw an uptick in markups since the start of the millennium. On the other hand, Cavalleri et al.
(2019) find that markups in the EU mostly have been stable or fallen slightly in the same period. The latter result is substantiated by Gutiérrez and Philippon (2018), though they measure market power in terms of operating margins.
The diverging conclusions from European studies indicate that methodological choices and data limitations may be affecting overall conclusions of the literature in an important way. Valetti et al. (2019) specifically point to three methodological issues which may pose challenges to the reliability of results when calculating industry concentration from firm-level data: sorting out ownership structures, dividing group sales to the relevant industries, and databases with increasing data coverage over time. We address these challenges for the case of Norway in our baseline analysis. Then we utilise the completeness of Norwegian firm level data to systematically test the effect of several types of data limitations other studies face, including the effect of only having data on large firms, the effect of majority and minority common ownership, and the choice of industry classification. We also test how including export-orientated industries affects our baseline results.
Our baseline results show that industry concentration in Norway has decreased slightly between 2000 and 2018.
In the same period, firm profitability has increased slightly for two out of four profitability measures. Although the overall trends differ, at industry level we find a robust and significant positive relationship between industry concentration and firm profits for three out of four profitability measures. These findings are consistent with the market power-hypothesis that concentration is an indicator for market power, leading to higher profitability.
Regarding the effects of various methodological choices and relevant data limitations, we find that including only the largest 50 companies in each industry by revenue results in an upward shift in the market concentration, though broader trends remain similar. The correlation between market concentration and profitability is less pronounced when excluding smaller companies. In addition, we find that adjusting for minority or majority ownership does not change trends in concentration levels, although the estimated relation between market concentration and profitability decreases slightly when using common ownership concentration measures.
Further, we find that using readily available industry classifications, such as SN3, gives a considerably smaller and
1 See Cavalleri et al. (2019) for an informative table over relevant literature.
3
less statistically significant relationship between concentration and profitability. We find similar results when testing the effect of including export-intensive industries which are exposed to serious measurement errors.
The regression results have immediate significance for future research. The results indicate that using readily available industry classifications, even as fine-grained as SN3, may present challenges when attempting to capture market dynamics, as these industries do not sufficiently resemble product markets. Further, the estimated coefficients capturing the relation between market concentration and profitability are sensitive to the inclusion of industries prone to measurement errors due to competition in global markets weaken the market power-hypothesis. One should be careful to reject or downsize the importance of the market power-hypothesis based on studies which fail to sufficiently handle these methodological challenges. Moreover, evidence from Norway does not find support for the minority ownership hypothesis, that increasing common minority ownership impacts competition negatively. This indicates that one needs to be less worried about controlling for the market power effects of common ownership in general studies of market power trends. Still, we find that controlling for various ownership types can result in large differences for certain industries. Thus, we do not rule out that controlling for ownership is relevant from a policy perspective when analysing individual industries.
Although concentration levels and trends differ across countries, we expect that market dynamics, in terms of competitional behaviour and the relationship between market concentration and profitability, are similar in most advanced economies. This suggests that the study’s findings, though conducted on Norwegian data, should have implications for the interpretation of other studies on trends in concentration.
The rest of the paper is structured as follows: Chapter 2 includes a review of relevant literature on market concentration. Chapter 3 presents data sources and how we constructed the relevant variables and classifications. In chapter 4 we present the results of the main analysis and a systematic testing of typical methodological challenges that macroeconomic studies on market power face. Chapter 5 concludes and discusses suggestions for further studies.
4
2. Literature review
A growing body of research shows that market concentration in the US has increased in recent decades.2 Using Economic Census individual company-level data, Autor et al. (2020) show that market concentration in the US increased significantly in the period from 1982 to 2012. Measured by 4-digit NACE, 75 percent of all industries saw a rise in market concentration between the GFC in 2008 and 2012. The authors suggest that this might be explained by an increase in the prevalence of high productivity “superstar firms”. Grullon et al. (2019) also find that market concentration has increased in the US between 1997 and 2014. This study applies a more aggregated industry definition for publicly traded companies (CRSP-Compustat) but reaches a similar result: market concentration has risen in 75 percent of all industries.
In contrast to the clear findings in the US, studies looking at market concentration in Europe reach varying conclusions. While some studies (e.g. Bajgar et al. (2019) and Guinea and Erixon (2019)) find that market concentration in Europe has increased, others find that concentration has been stable or even fallen in recent decades (see Gutiérrez and Philippon, 2018; Valletti et al., 2017; IMF, 2019; and Cavalleri et al., 2019).
Based on data from the Amadeus database, which encompasses data from both public and private companies, Gutiérrez and Philippon (2018) find that market concentration has fallen in the EU in the period from 1999 to 2005, after which it stabilised onwards to the end of the sample period in 2014. Analysing the development in the five largest EU economies using Euromonitor data, Valetti et al. (2017) also find that market concentration was stable from 2010 to 2015. Cavalleri et al. (2019) use data from ORBIS and iBACH on the four largest economies in the Euro area to show that market concentration has been stable in the period from 2006 to 2015.
Contrary to these studies, based on matched Orbis-Worldscope-Zephyr data, Bajgar et al. (2019) show that 75 percent of EU industries experienced increases in market concentration from 2002 to 2014.
The research dealing with analysing the change in market concentration over time varies a lot in terms of geographical scope, data sources used, time span and the definition of industries. Weche and Wagner (2020) conclude that the developments in market power do not seem to be transferable across regions, countries, or sectors. In addition, as pointed out by e.g. Monopolkommission (2018), most studies also suffer from a range of methodological problems, which in turn can contribute to the differences in results. Firstly, several papers are based on data sources with incomplete coverage. Valetti et al. (2019) also point out that the magnitude of the measurement error may be biased over time by the continual addition of companies in the database. Where the former makes it hard to generalize findings, the latter complicates comparisons over time. A second problem relates to the classic measures of market concentration which fail to take into account ownership structures in an industry. Several papers have documented large increases in common ownership in the US over the last decades, arguing that this may lead to anti-competitive effects (e.g. Gilje et al., 2020 and Backus et al., 2020).
However, Koch et al. (2021) find that common ownership is neither robustly positively related with industry profitability or output prices. Thirdly, macro level studies of market concentration will always face a market definition problem, as readily available industry classifications do not necessarily resemble product markets (see e.g. Backus et al., 2019).
The economic impact of increasing market concentration is debated. Potential effects include increases in markups (De Loecker and Eeckhout, 2020) and the decline in the labour share, through labour market dynamics (Autor et al. 2020, Barkai, 2020). Traditional oligopoly theory suggests that increasing market concentration leads
2 See Cavalleri et al. (2019) for an informative table of previous studies.
5
to increasing prices and profitability, often referred to as the market power-hypothesis. Assuming Cournot competition, it can be shown that higher market concentration (as measured by HHI) translates into higher prices and thus higher profit for a given revenue profile (Cowling and Waterson, 1976). Specifically, an HHI of 1.0 means monopoly pricing, whereas an HHI approaching 0 (perfect competition) will result in prices being set at marginal cost. Although the argument is weaker in a situation of Bertrand competition, this too will give rise to similar dynamics between competition and profitability as long as products are differentiated. However, increasing profits alongside increasing market concentration may also be explained by more productive firms gaining larger market shares. This theory is often referred to as the “superstar firm”-hypothesis (e.g. Autor et al., 2020 and Stiebale et al., 2020).
De Loecker and Eeckhout (2020) looked at markups for publicly traded companies in the US going back to 1950.
They find that markups have increased consistently since the 1980s. In the period from 1980 to 2015, the authors estimate that average markup has increased from 18 to 67 percent among US companies. In a large study of 74 countries in the period from 1980 to 2016, Diez et al. (2018) find a general increase in markups in advanced countries. In contrast, emerging and developing economies have not seen a similar increase. A similar study from the IMF (2019) was carried out on 27 countries from 2000 to 2015 and finds that markups have seen a moderate increase across advanced economies. Around two third of industries have seen increasing markups in the period, and in particular industries characterised by high digital take-up. They find that the US has seen the largest increase, while most EU countries have also seen an uptick in markup during the period. Studying the four largest economies of the Euro area, Cavalleri et al. (2019), however, find that markups have either been stable or fallen slightly in the period from 2000 to 2015. Similarly, Van Heuvelen et al. (2019) and De Loecker et al.
(2018) find that mark-ups in the Netherlands and Belgium, respectively, were stable from the early 2000s to 2016. De Loecker et al. (2018), however, show that the stability at the aggregate level masks systematic dynamics at the sector and firm level.
Based on French firm level data from 1995 to 2016, De Ridder (2019) finds an increase in both markups and industry concentration. His findings are in line with a theory model predicting that an increase in non-tangible fixed costs over time is a central explanatory factor for declining productivity growth, fall in business dynamism, and the growth of markups and firm concentration. Grullon et al. (2019) also find a positive and significant relationship between market concentration (measured by HHI) and profit margins (measured by both ROA and operating margins) for US companies. The authors find that the relationship has strengthened over time and has been stronger from 2000 onwards. Similarly, Barkai (2020) finds a positive relationship between the increase in rents and increase in market concentration as measured by the four largest companies’ share of total revenues within the industry (C4).
6
3. Data
The main data used in the analysis comes from the Brønnøysund Register Centre. The Brønnøysund Register Centre is a government agency charged with collecting a whole range of data. Among these is the collection of annual financial statements of all limited companies in Norway. The database used in the analysis consists of the universe of Norwegian income statements and balance sheets from 1992 to 2018. To the best of our knowledge, there are few other company databases as comprehensive as this one.
The financial statements in the database cover all essential accounting metrics for the companies included. Most importantly, this encompasses total revenue, operating costs and profits, total wage compensation (as well as a separate entry for salary only) as well as financial income and costs. On the income statement, the data further includes depreciation and amortization. However, due to regulatory changes in 2005, which saw the introduction of IFRS accounting standard in Norway, these entries are not entirely comparable over the timespan covered by the database. From the data on the income side, we can calculate relevant measures of profitability (EBIT, EBITDA, and net profit) as well as gross value added (by subtracting operating costs from revenue). On the balance sheet, we have a full specification of both assets (including cash, short-term assets, fixed assets, and others) and liabilities (short- and long-term debt as well as accounts payable).
Ownership data are collected from the notes of the companies’ financial statements and cover the entire dataset dating back to 2000. Norwegian authorities have published a complete shareholder register of all Norwegian companies from 2015 and onward. We have done a comparison of the two data sources and find that they are highly comparable. For the ownership data, we roll back ownership structures so that we end up with the ultimate owner. An ultimate owner is in this case either a Norwegian person, the Norwegian government, a self- owned organization, or a foreign actor.
3.1. Industry classification
Cross industry studies of market concentration face issues in defining markets, as readily available industry classifications do not necessarily resemble product markets (e.g. Backus et al., 2020). This is a methodological challenge, as the market power-hypothesis is based on the assumption of well-defined product markets. The objective of defining a market is to identify actual competitors of a firm that are capable of constraining firm behaviour and of preventing the company from behaving independently of effective competitive pressure (EC, 1997). Hence, markets used should consist of firms exerting competitive constraints on each other.
Most of the relevant literature relies on readily available industry classifications for this purpose. However, none of the standard industry classifications seem to systematically capture actual product markets. On one hand, industries might be too broadly defined, including firms who act completely independently of each other. On the other hand, the industries could be too narrowly defined with competing firms ending up in separate industries.
Examples from the much used 3-digit NACE serve to illustrate these two issues.3 The 3-digit industry “477 – Retail sale of other goods in specialized stores” includes a range of unrelated product markets, from clothing to flowers to jewelleries. On the other hand, one could argue that the industries “551 – Hotels and similar accommodations”
3 NACE-codes are a pan-European system for classifying companies by industry. While 4-digit NACE codes are the same for all European countries, 5-digit NACE-codes are a Norwegian extension which takes into account some Norwegian idiosyncrasies, mainly in aquaculture and the maritime industries.
7
and “552 – Holiday and short-stay accommodations” are too narrowly defined from a product market perspective, as many firms in these industries are competing.
It is close to an impossible task to create industry classifications that fully capture product markets across the entire population of firms. The examples above do however illustrate the potential for improving the existing classifications. In order to construct industry categories that approximate markets in the best possible way, we have done extensive manual work to combine disaggregated industry classifications at 5-digit NACE level. All of the roughly 800 individual NACE-codes at the 5-digit level have been categorised into industries resembling product markets. This has been done in such a way that NACE code industries where companies produce similar products, or easily could adjust their production to do so, have been put into a common industry. An example can serve to illustrate this: in the product market-oriented industry “Agriculture”, we have included domestic farmers in addition to importers of agricultural products.4 For the industries where the clustering was the least straightforward, we performed a manual investigation of the largest companies in the relevant NACE codes. As for the examples stated in the section above, we find it more accurate to use the 2-digit NACE code for accommodation, while product markets for retail are better captured at a 4-digit NACE code level. All industries and associated 5-digit NACE codes are presented with notes in Appendix B. The exercise leaves us with 180 industry categories, which we believe capture many of the elements of product markets. In chapter 4.3., we test the effect of using readily available industry classifications instead of these product market-oriented industry definitions.
Nevertheless, not all of these industries exhibit sufficient competitive behaviour captured in the universe of Norwegian companies. From these 180 industry categories we have excluded four sets of industries. Firstly, we have excluded industries which are dominated by non-profit firms or industries that are heavily regulated.
Examples include education and the regulated national gambling monopoly. Secondly, we exclude exporting industries, as these firms face competitive constraints from firms not covered by our data.5 In chapter 4.4 we test how excluding these industries impacts the analysis. Thirdly, we have excluded industries dominated by franchising. These industries face measurement errors, as it has not been possible to connect the individual franchisee to the franchisor. Fourthly, we have left out industries which have been deemed to insufficiently resemble product markets.
This exercise narrows the number of industries down to 100 and covers about a third of the gross product of the private sector in Norway. The large gross product of the excluded sectors is mainly driven by the outsized importance of the Norwegian petroleum sector. Table 1 displays some descriptive statistics on the number of firms, total revenue and total value added for the 100 industries in our sample.
4 The following NACE codes were included in the product market industry code: Perennial and non-perennial crop producers (group 01.1 and 01.2), support activities for crop production (class 01.61), plant propagation (group 01.3), wholesale of flowers and plants (class 46.22) and wholesale of fruit and vegetables (class 46.31).
5 A similar issue relates to industries with high import competition. We have not explicitly excluded any industries because of this. Most of the relevant industries are already excluded due to the export-criteria. For other industries, we have sought to mitigate the issue by pooling domestic producers together with import agents. There are, however, still some direct-to-user imports that are uncontrolled for, which may bias our results. Data from Statistics Norway shows that purchases from internationally based e-commerce have increased fivefold since 2010 (Statistics Norway, 2021).
This could potentially affect the development in both margins and concentration ratios for the affected industries. Due to data limitations, we have not been able to control for this potential bias in this paper.
8 Table 1: Descriptive statistics for the 100 industries for 2018. MNOK.
mean min max p10 p50 p90
Number of firms 1 180 20 18 340 90 420 2 670
Revenue 23 090 520 272 930 1 240 6 720 46 730
Value added 7 810 70 104 510 440 3 070 18 690
N 100
3.2. Measures of market concentration
There exist a variety of different measures for market concentration. The most widely used are the Cn and the Herfindahl-Hirschman index (HHI). The Cn measures concentration as the market share of the n largest companies. Yet, our main measure will be the HHI. For any given industry, j, HHI is defined as:
𝐻𝐻𝐼𝑗= ∑ 𝑠𝑖2 𝑁
𝑖=1
,
where 𝑠𝑖 is the market share of the i’th company. In other words, HHI measures the sum of squared market shares. HHI in its raw form will always lie between zero and one, but we follow the literature and multiply by 10 000. A market with perfect monopoly will have an HHI of 10 000, whereas a market with an infinite number of small producers will have an HHI of approximately zero.
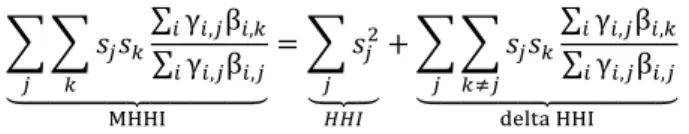
We calculate three different measures of HHI for each industry. The first is the standard index computed using firm level financial statements. The second is constructed to handle the issue of corporate group structures, by aggregating revenues of firms belonging to the same corporate group within the same industry, before calculating the HHI. We refer to this measure as the corporate group-adjusted HHI (CG HHI). The third is the so- called modified Herfindahl-Hirschman index (MHHI). This attempts to capture common minority ownership of companies, where management attempts to maximize owner profits, rather than company profits. In other words, the objective function for the firm can be written as:
𝑚𝑎𝑥 𝜋𝑗= ∑ γ𝑖,𝑗 𝑖
∑ β𝑖,𝑘 𝑘
𝜋𝑘,
where 𝛽𝑖,𝑘is the ownership share of company i in company j, and 𝛾𝑖,𝑗 is the vote share of company i in company j. Thus, management in company j may be incentivised to maximize profit in any company with any weight, since any given owner i of company j might also be an owner in company k. Assuming Cournot competition, O’Brien and Salop (1999) show that this leads to the MHHI first proposed by Reynolds & Snapp (1986):
𝑀𝐻𝐻𝐼 = ∑ ∑ 𝑠𝑗𝑠𝑘
∑ γ𝑖 𝑖,𝑗β𝑖,𝑘
∑ γ𝑖 𝑖,𝑗β𝑖,𝑗
𝑘 𝑗
We can re-write this as follows.
𝑀𝐻𝐻𝐼 = ∑ 𝑠𝑗2 𝑗
+ ∑ ∑ 𝑠𝑗𝑠𝑘
∑ γ𝑖 𝑖,𝑗β𝑖,𝑘
∑ γ𝑖 𝑖,𝑗β𝑖,𝑗 𝑘≠𝑗
𝑗
We can decompose it into the traditional HHI and a delta HHI as follows
9
∑ ∑ 𝑠𝑗𝑠𝑘
∑ γ𝑖 𝑖,𝑗β𝑖,𝑘
∑ γ𝑖 𝑖,𝑗β𝑖,𝑗 𝑘
⏟ 𝑗 MHHI
= ∑ 𝑠𝑗2
⏟ 𝑗 𝐻𝐻𝐼
+ ∑ ∑ 𝑠𝑗𝑠𝑘
∑ γ𝑖 𝑖,𝑗β𝑖,𝑘
∑ γ𝑖 𝑖,𝑗β𝑖,𝑗 𝑘≠𝑗
⏟ 𝑗 delta HHI
Due to a lack of knowledge of vote shares we assume proportional control such that γ𝑖,𝑗= β𝑖,𝑗 for the rest of the analysis.
In chapter 4.2. we will investigate the effect of taking ownership into account when constructing measures of market concentration and the relationship between concentration and profitability. For our main specification we will use the corporate group-adjusted HHI, as we believe this to best capture competition dynamics. Table 2 displays some descriptive statistics on the different concentration measures for the 100 industries in our sample.
Table 2: Descriptive statistics on concentration measures for the 100 industries in our sample.
mean min max p10 p50 p90
Unadjusted HHI 1 262 19 6 199 224 818 2 737
Corporate group-adjusted HHI 1 458 28 6 430 269 1 014 3 067
Modified HHI 1 507 30 6 544 269 1 061 3 076
N 100
3.3. Measures of profitability
In this paper we use four different measures of profitability: EBIT margin, EBITDA margin, return-on-assets (ROA) and markup.
EBIT margin
We calculate the EBIT margin by dividing earnings before interest and taxes, or the operating profit, by total revenues. The EBIT margin is a good indicator for changes in profitability within an industry over time.6 In general margins as measures of profitability offer the advantage of relying solely on variables on the income statement, as opposed to balance sheet variables, which more often yield measurement errors. However, EBIT margins will be subject to noise by being subject to write-downs certain years.
EBITDA margin
Earnings before interest, taxes, depreciation, and amortization can be calculated by summing operating profits, depreciation, and amortization. The margin is calculated as a share of revenues. The EBITDA margin’s main attractive feature is that it excludes the volatile and noise-prone depreciation and amortization variables. On the other hand, however, depreciation and amortization are measures of actual operating costs, and using EBITDA poses a balancing act between not measuring underlying profitability and including too much noise. Using both margins will give a more complete overview of the actual development of profitability.
6 If there is no shift in technology shifting the balance between labor and capital as input.
1 0 Return-on-assets
We calculate ROA by dividing net income by the average total assets for each year. In the literature, ROA is the most used measure to capture profitability. This is a particularly good measure for listed companies where assets are based on market prices. This is, however, more problematic for non-listed companies, because the balance sheet value of the firm assets does not necessarily reflect the true market value of the firm. Another methodological challenge of using ROA is the fact that an increasing number of companies report their accounting data according to the IFRS. For these companies, the gap between equity and actual market value will be smaller. A third problem is the fact that equity may be double counted by firms in the same corporate group. An advantage of using ROA as a measure of profitability is that it takes into account changes in capital structure within an industry over time.
Markup
Markup relates a firm’s ability to maintain a price level on a certain good to the marginal costs of producing the good. As both prices and marginal cost is unobservable, it is not possible to accurately calculate the markup for each good. Instead, we follow Cavalleri et al. (2019) and calculate markup for each firm as follows:
markup =𝑟𝑒𝑣𝑒𝑛𝑢𝑒 − 𝑜𝑝𝑒𝑟𝑎𝑡𝑖𝑛𝑔 𝑐𝑜𝑠𝑡𝑠
𝑜𝑝𝑒𝑟𝑎𝑡𝑖𝑛𝑔 𝑐𝑜𝑠𝑡𝑠 =𝑜𝑝𝑒𝑟𝑎𝑡𝑖𝑛𝑔 𝑝𝑟𝑜𝑓𝑖𝑡 𝑜𝑝𝑒𝑟𝑎𝑡𝑖𝑛𝑔 𝑐𝑜𝑠𝑡𝑠
This expression of the markup only equals the theoretical markup if the firm produces a single good, all capital is categorised as fixed costs and the firm’s production function exhibits constant returns to scale, in other words, the function is homogenous of degree 1. However, even when that is not the case, the markup provides information on the ability of firms to raise prices.
Table 3: Descriptive statistics on profitability measures in 2018 for the 100 industries in our sample
mean min max p10 p50 p90
EBIT 0.074 -0.025 0.570 0.013 0.046 0.139
EBIDTA 0.108 -0.016 0.605 0.030 0.080 0.223
ROA 0.057 -0.021 0.408 0.011 0.052 0.104
Markup 0.143 -0.016 1.532 0.031 0.087 0.287
N 100
While the EBIT margin, EBITDA margin and markup all have correlation coefficients of around 0.9 in all three pairings, the correlation between ROA and the other measures is between 0.25 and 0.5. This is most likely a function of the expected noise in the calculation of ROA for unlisted companies.
1 1
4. Results
The figure below shows the development of overall corporate group-adjusted (CG) HHI in the period 2000-2018, both unweighted and weighted by industry revenue. The figure shows a slight decrease in concentration ratios throughout the period, for both weighted and unweighted industry average. Weighted CG-adjusted HHI has fallen from above 1400 to below 1200, with a maximum of 1600 in 2004. For the unweighted CG-adjusted HHI, the development can be split up into two periods. Concentration falls from around 1750 to 1450 from 2000 to 2006 and has remained quite stable since.
Figure 1: The development of corporate group-adjusted HHI from 2000 to 2018 (unweighted and weighted by industry revenue)
In general, overall market concentration has seen a moderate decrease in Norway during the period. The overall picture does, however, conceal large individual variations between industries. Of the 100 industries, 58 experienced a fall in CG-adjusted HHI, while the remaining 42 saw an increase.7 For illustrative purposes we cluster our industries into 12 aggregate sectors. The share of industries within each aggregated industry having experienced an increase in HHI is plotted below.
7 This is true whether you measure the actual change in HHI or look at the regression coefficient from the earliest to the latest year.
600 800 1 000 1 200 1 400 1 600 1 800 2 000
2000 2001 2002 2003 2004 2005 2006 2007 2008 2009 2010 2011 2012 2013 2014 2015 2016 2017 2018 Industry average Weighted industry average
1 2
Figure 2: The share of industries within each aggregated industry with an increase in HHI between 2000 and 2018. Number of industries in parentheses.8
In manufacturing, all of the industries (4 of 4) experienced increases in market concentration, followed by financial services and real estate and construction. For these aggregated industries, roughly half of industries saw an increase in HHI. In the other end, public services saw no industries with an increase, while only 6 of 26 industries within professional services experienced increases.
If we see past the high profitability in 2000 driven by the dotcom-bubble, all of our profitability measures have increased in the period of analysis. Average markup has increased from a low point of 13 percent in 2001 to 21 percent in 2018. For the other three measures, the increases are smaller, and there have not been any real movements since the Global Financial Crisis of 2008. We also notice the lack of movement in connection with the oil price fall of 2013-2015, in general thought to have represented a major shock to the Norwegian economy.
This is due to the exclusion of export-orientated industries, since most oil price sensitive industries, mainly exploration and maritime industries, are excluded in the analysis.9
8 Additional information on the magnitude of changes in HHI in these aggregated industries can be found in Table 19 in the appendix.
9 Export-oriented industries are explicitly handled in chapter 4.3.
1.00
0.60 0.60
0.53 0.50 0.50 0.50
0.29
0.25 0.23
- -
0.25 0.50 0.75 1.00
Share of sub-industries with HHI increase
1 3 Figure 3: The development of four profitability measures from 2000 to 2018
We now turn to analysing the potential co-movement between profitability and concentration. This will be done via a main specification applied to different sub-samples, explanatory variables, dependent variables, and industry classifications. This approach is akin to a series of robustness checks, aimed at testing the sensitivity of conclusions to methodological choices.
Although both concentration levels and profitability have been relatively stable over the period, we want to test the relationship at the individual sector level. We do this by estimating the following model:
Yi,t= αt+ αi+ βi,tX + γ𝐶i,t+ εi,t
where Yi,t is the relevant profitability measure (e.g., EBITDA margin) in the i’th industry, in period t. Ci,t is market concentration measured by one of the HHI measures for industry i, in period t. Xi,t is a vector of control variables, which in the main specification is the logarithm of assets.10 In the analysis we control for industry-specific fixed effects. This controls for the fact that some industries have higher margins than others, independent of the level of market concentration.11 Additionally, the estimated model uses time-fixed effects, capturing tendencies for all industries to experience changes in profitability driven by changes in business cycles. These are captured by αi and αt respectively. Our main parameter of interest is γ, which tells us about the correlation of HHI and profitability. The table below exhibits the main results using the CG-adjusted HHI measure.
10 The control in the main specification is logarithm of total assets and is significant at p=0.05. Yet excluding it or using revenue instead of assets changes little in the size of the 𝛾 estimate. See Appendix B for robustness checks.
11 It is hard to judge intuitively whether we ought to use random or fixed effects. A standard Hausman test points to fixed effects.
0 0.05 0.1 0.15 0.2 0.25
2000 2001 2002 2003 2004 2005 2006 2007 2008 2009 2010 2011 2012 2013 2014 2015 2016 2017 2018
EBIT EBITDA ROA Markup
1 4 Table 4: Regression results main specification12
We find positive relationships between industry concentration and profitability for the regressions involving the EBITDA margin, EBIT margin, and markup. It is not surprising that the return-on-assets measure provides no significant coefficient, as the measure is noise-prone for unlisted companies without a market valuation.
The coefficient size in these regressions is not easily interpretable. However, the corelation can be illustrated as follows: a coefficient of 0.982 means that the fall in weighted HHI from 1425 in 2000 to 1135 in 2018 (equal to the development of the weighted average) has contributed to a fall in total economy-wide EBITDA margin of 0.28 percentage points. Unsurprisingly, the models have low R2. This is a consequence of the fact that there are a variety of factors explaining short term variations in industry level profitability, including investment cycles, technological shifts or demand related factors not controlled for in the analysis. Thus, market power, proxied by market concentration, is only one of many factors affecting profitability. Yet, the F-statistics show that the models are statistically significant in explaining developments in profitability at the industry level.
In the main specification there is no transformation of key variables, including profitability and market concentration. A traditional logarithmic transformation would have complicated coefficient interpretation of the dependent variables, as these are already expressed in percentages. Moreover, it would have had some undesirable consequences for the explanatory variables as it would have emphasized relative changes in the HHI indices. In other words, it would have equated a change from 150 to 300 with one from 1500 to 3000. Yet, as an additional robustness check we run two additional specifications, namely one with a logarithmic transformation of the HHI indices, and one where we include a quadratic HHI term as an explanatory variable.13 For the former, the fit of specification as well as the p-values are approximately unchanged, and the marginal effect of an increase in HHI around the median HHI is similar. For the latter, we find that the quadratic term for most dependent variables is negative and significant. Although the fit of the specification is unchanged, it points to the possibility that the marginal effect of HHI may be decreasing to the point where it turns negative. This point, however, is not reached before the 96th percentile of HHIs and is thus of little practical importance.
12 Note that coefficients have been multiplied by 105 for easier comparison.
13 See Appendix B for results of the robustness checks.
1 5
4.1. Exclusion of smaller companies
In general, most of the earlier market concentration literature uses data sets consisting of a subset of existing companies, using either databases such as Orbis and Compustat, or data on publicly traded companies. Common for these data sources is the lack of full company coverage. More specifically, the databases tend to include only large companies. Failing to include smaller companies will mechanically lead to inflated concentration levels and could potentially also bias results if there is a trend that smaller companies have a larger or smaller market share over time. To illustrate the effect of incomplete coverage, we start by re-calculating the average CG-adjusted HHI measure, only including the 50 largest companies in each industry.14 This equates to removing 97,5 percent of companies, corresponding to about 30 percent of revenue and 35 percent of value added of the total sample.
Figure 4: The development of CG-adjusted HHI from 2000 to 2018 when only including top 50 companies by revenue for each industry, including baseline results for comparison.
As expected, Figure 4 shows that excluding smaller companies leads to an upward shift in market concentration.
Excluding smaller companies does not seem to change the trend development in concentration levels, which indicates that most of the national market concentration is driven by the larger companies. and that the relative market share of smaller companies is relatively stable over time. What is more interesting is whether the exclusion of small companies alters the results of the regression of market concentration on profitability. The effects are shown in the table below, which displays smaller coefficients for all profitability measures compared to the results based on the full sample of companies.
14 This criterion is the same as Gutiérrez and Philippon (2018) apply on European data when mimicking US listed companies.
600 800 1000 1200 1400 1600 1800 2000 2200
2000 2001 2002 2003 2004 2005 2006 2007 2008 2009 2010 2011 2012 2013 2014 2015 2016 2017 2018 Only large companies - industry average Only large companies - weighted industry average Main results - industry average Main results - weighted industry average
1 6 Table 5: Regressions results when excluding small companies
Although smaller, the estimates in this specification are not significantly smaller. The results thus justify utilising incomplete datasets, in a case where a large share (measured by share of total revenue) of all large companies is available. Furthermore, we have tested the effect of other exclusion criteria. Specifically, we have run the regression where all companies with revenues less than NOK 50m, NOK 100m, NOK 500m and NOK 1bn respectively have been excluded. For the less restrictive exclusions criteria, we reach similar conclusions, namely that the exclusion makes comparatively small differences to the regression results. However, when excluding companies with revenues less than NOK 500m or NOK 1bn, the coefficient estimates become decidedly more volatile, thus pointing to the fact that incomplete datasets might present inference problems in some cases. All regression tables are presented in the appendix.
4.2. Testing the importance of ownership structures
In the main specification we control for majority common ownership, or firms belonging to the same corporate group. Yet, minority common ownership may also influence the competition intensity within an industry. The common ownership hypothesis suggests that if an investor owns shares in multiple firms within the same industry, these firms have less incentive to compete aggressively against each other (e.g. Backus, 2020). The idea is that managers know the interests and ownership shares of each investor, as well as the investors’ ownership in other companies, and would seek to maximize the total profit of these investors combined. To account for such dynamics, we have calculated the modified HHI, as explained in the data chapter.
The graphs below display how concentration levels have developed in Norway over the last two decades for the different measures of HHI: the regular unadjusted HHI, the corporate group-adjusted HHI and the modified HHI.
By construction, the corporate group-adjusted HHI is higher than regular unadjusted HHI, while the modified Herfindahl is highest. Our results indicate that the changes in average HHI to a large degree remain the same regardless of the measure used, with declining concentration levels throughout the period. The difference between regular unadjusted HHI and corporate group-adjusted HHI has increased slightly throughout the period, while the difference between corporate group-adjusted HHI and modified HHI has decreased.
1 7 Figure 5: The development of three measures of HHI from 2000 to 2018 (unweighted and weighted)
Even though the development in trends is similar at an average level, controlling for majority and minority ownership may have a large impact on individual industries. Below we present the development in the different concentration measures for three industries that are particularly relevant for regulatory competition authorities.
For the telecom industry, we find a large jump in regular HHI in 2008, as two of the largest companies under the Telenor corporate group merged. Looking at regular HHI, this merger conceals the large downward trend in concentration that is evident when looking at CG HHI and MHHI. For the publishing industry, we find a large increase in concentration levels for all of our measures. However, the increase is almost 50 percent larger when controlling for minority ownership. For the power industry, we find large differences between the concentration levels when looking at the different measures. The large differences between MHHI and the other measures are mainly a result of large national ownership shares in different firms, mainly through the two largest companies in this industry: Statkraft and Hydro.
Figure 6: The development of the three measures of HHI from 2000 to 2018 for the telecom, publishing, and power industry 600
800 1000 1200 1400 1600 1800 2000
Unweighted
HHI CG HHI MHHI
600 800 1000 1200 1400 1600 1800 2000 2200
Weighted
HHI CG HHI MHHI
600 1600 2600 3600 4600 5600 6600 7600
2000 2002 2004 2006 2008 2010 2012 2014 2016 2018
Telecom
HHI CG HHI MHHI
600 800 1000 1200 1400 1600 1800 2000
2000 2002 2004 2006 2008 2010 2012 2014 2016 2018
Publishing
HHI CG HHI MHHI
0 500 1000 1500 2000 2500 3000 3500 4000 4500
2000 2002 2004 2006 2008 2010 2012 2014 2016 2018
Power
HHI CG HHI MHHI
1 8
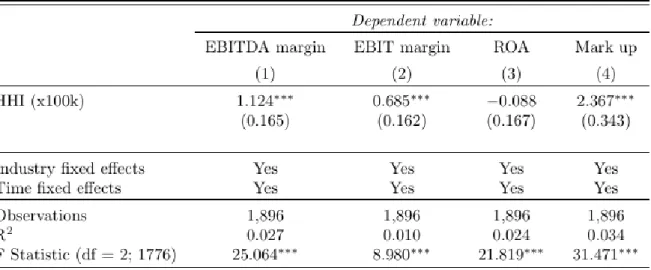
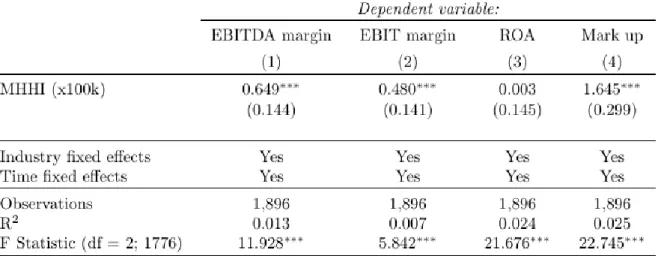
We have tested the relationship between concentration and profitability for the different measures of HHI, presented in Table 6 and Table 7 below, using the same econometric framework as we used for our main specification. We find that the regression results are quite robust for different ownership-adjusted concentration measures. Particularly for unadjusted HHI we observe that the results are similar to the ones for the corporate group-adjusted HHI. The results are quite similar for the modified HHI, which also indicates a positive relationship between concentration levels and profitability for all the relevant measures.15 These results are, however, slightly less economically and statistically significant compared to the main specification. As covered in the data section, the modified HHI is defined as the sum of CG HHI and a delta-component covering minority common ownership.
This allows us to test the effect of the minority common ownership-component directly. Running a regression with the two parts of the MHHI as to separate regressors gives similar results as the main specification for CG HHI16. The coefficients on the delta-component are not statistically significant for three out of four profitability measures, and negative and statistically significant for EBIDTA. Thus, our analysis does not lend support to the common ownership hypothesis for which we would have expected a higher correlation and an increased explanatory power of the model itself, consistent with the findings in Koch et al. (2021).
Table 6: Regression results when using HHI not adjusted for any ownership structures
15 The overall conclusion changes little if ∆MHHI (the wedge between corporate group-adjusted HHI and modified HHI corrected for minority ownership) is included as an explanatory variable. See Appendix B for results of the robustness checks.
16 See table18 in appendix for regression table.
1 9 Table 7: Regressions results using the modified HHI
4.3. Testing the importance of industry classifications
Most studies regarding market concentration use a traditional industry classification. As discussed previously, this may be a sub-optimal way of capturing product markets. To illustrate the effects of using a standard industry classification rather than a classification which resembles product markets more closely, we replicate our analysis using the SN3 industry classification.
Figure 7: The development of HHI from 2000 to 2018 for the SN3 industry classification, including baseline results for comparison.
600 800 1000 1200 1400 1600 1800 2000
2008 2009 2010 2011 2012 2013 2014 2015 2016 2017 2018 2011 2012 2013 2014 2015 2016 2017 2018 SN3 - industry average SN3 - weighted industry average
Main results - industry average Main results - weighted industry average
2 0
The results show no significant changes in levels and trends for the unweighted average market concentration.
For the weighted industry average, we find that concentration ratios on average are about 200 points lower when using SN3 industry classification, although the trends remain similar. Overall, using the SN3 industry classification instead of the more product market-oriented industries does not affect the aggregated concentration levels and trends to a large extent. We find similar results using the SN2 classification, presented in appendix. This industry classification consists of fewer and larger industries, which unsurprisingly yields lower concentration ratios, while trends remain similar.
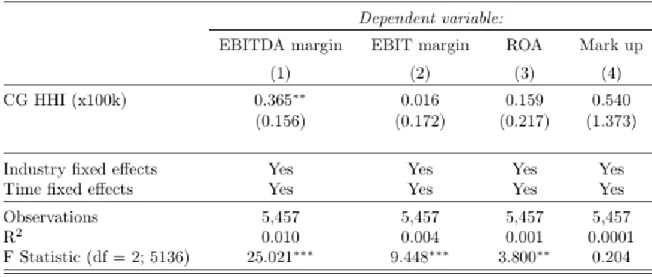
The results for the regression analysis using the SN3 industry classification, as seen in table 5, diverge from the results from the main analysis. It is only the coefficient in the EBITDA specification which remains statistically significant, and coefficients in the EBIT, EBITDA and markup regressions are statistically smaller than in the main specification. Taken together, the results indicate that using readily available industry classifications, even as fine-grained as SN3, may present challenges when attempting to capture product market dynamics.
Furthermore, as the relationship between concentration and profitability is more evident when using more product market-oriented industry classifications, the results are consistent with the market power-hypothesis.
Table 8: Regression results using SN3 industries
4.4. Exclusion of export-oriented industries
Some firms operate mainly in national markets while other firms operate mainly in international markets. For firms operating in international markets, there is no clear hypothesis regarding the relationship between national concentration levels and profitability. The reason is that export intensive industries contain large measurement errors with respect to measuring market concentration levels based on national data. This distinction is particularly relevant for Norway as a small open economy which relies on export of commodities due to a small home market. For this reason, we have divided our dataset into industries which operate mainly at home and industries with a high export intensity. While the main analysis above excluded industries operating mostly internationally, we will now turn to industries characterised by higher export intensity.
2 1
The national concentration levels for exposed industries are displayed in the graph below. In contrast to the results for the sheltered sector, the national concentration levels for the exposed sector increase throughout the period. The unweighted industry average corporate group-adjusted HHI increases from about 1400 at the start of the period to close to 1700 in the end of the period, while the weighted average increases from about 2100 to 2900. The variation in the weighted average concentration level is mainly driven by the oil and gas industry, which accounts for about 25 percent of national revenue, and 50 percent of the revenue in the exposed sector.
Figure 8: The development of HHI from 2000 to 2018 for the export-classified industries, including baseline results for comparison
Including export-orientated industries in the data set, the regression analysis fails to find any statistically significant relationship between concentration levels and profitability for all of the profitability measures. In two out of four cases, we also find that the coefficients are statistically significantly different from the coefficient in the main regression. This suggests that it is important to exclude exposed industries as long as one does not have information on international competitors, and that studies which fail to do so may suffer from biased results.
600 1100 1600 2100 2600 3100 3600 4100
2000 2001 2002 2003 2004 2005 2006 2007 2008 2009 2010 2011 2012 2013 2014 2015 2016 2017 2018 Export industries - industry average Export industries - weighted industry average Main results - industry average Main results - weighted industry average
2 2 Figure 9: Regression results when including export-oriented industries
2 3
5. Conclusions
This paper’s aim has been two-fold. Firstly, we have investigated market concentration and the relationship between market concentration and profitability in Norway using a complete dataset. Secondly, the paper has analysed the significance of a range of methodological choices and potential data limitations, which any cross- industry analysis of market concentration confronts.
Regarding the first aim of the paper, we find that average market concentration in Norway has decreased slightly over the last two decades, both unweighted and weighted by industry size. Using ROA and markup as profitability measures, we find that profitability has increased slightly over the same period, while EBIT and EBIDTA has remained stable throughout the period. Taken together, these findings do not indicate a general trend towards decreasing competition in the Norwegian economy, as has been documented for the US and in certain studies of European countries. Although overall HHI has not increased over the period, the inter-sectoral relationship between market concentration and profitability need not be zero. We analyse this relationship using a fixed effects model with both industry- and time-specific fixed effects. The analysis documents a positive and statistically significant relationship between concentration and profitability for three out of four profitability measures, in line with the market power-hypothesis.
In the second part of the paper we make use of the extensive dataset consisting of the entire universe of Norwegian limited companies, including full ownership data, to test the impact on results of central methodological choices and of potential data limitations. We study both the effect on the level and trend in market concentration as well as the effect on the relationship between market concentration and profitability.
The methodological choices we study are related to 1) the exclusion of small companies, 2) correcting for various types of ownership, 3) using different industry classifications, and 4) excluding export-oriented industries. We hypothesise that all these methodological choices affect the measurement of market concentration and its relationship with profitability.
We find varying, but important effects of all methodological choices. For 1), we examine the effects of excluding small companies. Here we find that the exclusion has no or little effect on the concentration level nor on the correlation between market concentration and profitability relative to the main specification. This implies that using a database of companies without full coverage of smaller companies does not bias results in any significant way. However, it should be noted that this cannot necessarily be extended to any incomplete database, such as one with only public companies, or datasets with increasing coverage over time.
For 2) we find that controlling for ownership makes a relatively small difference in the overall market concentration trend. Nonetheless, we show that controlling for ownership can have sizable effects on individual industries. For the regressions we reach similar conclusions independently of whether the concentration measures take ownership into account, with a positive and significant relationship between concentration and profitability for three out of four profitability measures. Further, we find that the coefficient is largest for regular HHI, and smallest for modified HHI, though the difference is insignificant. In other words, the more we control for ownership, the weaker the relationship. Thus, we do not find any support for the minority ownership hypothesis. Our results suggest that not controlling for ownership structures does not necessarily present a major problem with respect to capturing the general development in concentration levels for the economy.
In 3), we re-run the regressions using a standard SN3 industry classification. Looking at concentration levels and trends, using a SN3 industry classification gives similar results as in our main analysis, albeit somewhat lower concentration levels for the weighted industry average. In addition, we find that the relation between industry
2 4
concentration and profitability changes. In particular, of the three coefficients that are positive and significant in the main specification, all have statistically lower coefficients and only one remains significant. Also, the adjusted R2 falls in all specifications. Taken together, the results indicate that using readily available industry classifications, even as fine-grained as SN3, may fail to capture market dynamics.
Lastly, in 4), when re-including export-oriented industries in the data set, we find that market concentration is significantly more volatile driven mainly by cycles in the international petroleum sector. Also, we find that all coefficient estimates on the relation between profitability and industry concentration move significantly closer to zero. Thus, including export industries in any analysis of market concentration may bias the regression coefficients downward, leading to an understatement of the relationship between industry concentration and profitability.
Overall, our results indicate that measuring the relationship between industry level concentration and profitability is sensitive to methodological choices and data issues which face most researchers. This holds especially true for the choices regarding market definition, as well as including industries prone to measurement errors in the data, such as export-orientated industries. The finding is relevant from a policy perspective as one should be careful when interpreting studies of market concentration which fail to sufficiently handle these methodological challenges.
Our study is relevant for future research. The analysis indicates a need for openness about (the effects of) methodological choices, for a broad set of sensitivity tests, and additional cautiousness in conclusions. Although concentration levels and trends differ across countries, we expect that market dynamics, in terms of competitional behaviour and the relationship between market concentration and profitability, are similar in most advanced economies. This suggests that the study’s findings, though conducted on Norwegian data, should have implications for the interpretation of other studies on trends in concentration. Our paper does however not address the effect of all possible methodological challenges in this field of study, due to scope and/or data restrictions. To strengthen the literature further, future research should seek to identify and address these challenges. One example of an unaddressed challenge is the effect of imports on concentration ratios and margins. Another potential challenge is related to the geographical dimension of competition within countries.
Many product markets, especially in the service industries, are geographically bound, and one would expect that only firms within reasonable proximity would exert competitive constraint on each other. Further, our analysis highlights the need for updated industry classifications with a more product market-oriented focus, preferably including an export/import-dimension.
2 5
6. References
Autor, D., Dorn, D., Katz, L. F., Patterson, C., & Van Reenen, J. (2020). The fall of the labor share and the rise of superstar firms. The Quarterly Journal of Economics, 135(2), 645-709.
Backus, M., Conlon, C., & Sinkinson, M. (2020, May). Theory and Measurement of Common Ownership. In AEA Papers and Proceedings (Vol. 110, pp. 557-60).
Backus, M., Conlon, C., & Sinkinson, M. (2019). Common ownership in America: 1980-2017 (No. w25454).
National Bureau of Economic Research.
Bajgar, M., Berlingieri, G., Calligaris, S., Criscuolo, C., & Timmis, J. (2019). Industry Concentration in Europe and North America (No. 18). OECD Publishing.
Barkai, S. (2020). Declining labor and capital shares. The Journal of Finance, 75(5), 2421-2463.
Cavalleri, M. C., Eliet, A., McAdam, P., Petroulakis, F., Soares, A. C., & Vansteenkiste, I. (2019). Concentration, Market Power and Dynamism in the Euro Area. (ECB Working paper series No. 2253).
Cowling, K., & Waterson, M. (1976). Price-cost margins and market structure. Economica, 43(171), 267-274.
De Loecker, J., Eeckhout, J., & Unger, G. (2020). The rise of market power and the macroeconomic implications. The Quarterly Journal of Economics, 135(2), 561-644.
De Loecker, J., Fuss, C., & Van Biesebroeck, J. (2018). Markup and price dynamics: linking micro to macro. National Bank of Belgium, Working Paper No. 357.
De Ridder, M. (2019). Market power and innovation in the intangible economy. Cambridge-INET Working Paper Series No: 2019/08
Diez, M. F., Leigh, M. D., & Tambunlertchai, S. (2018). Global market power and its macroeconomic implications.
International Monetary Fund.
European Commission. (1997). Commission notice on the definition of relevant market for the purposes of Community competition law. Official Journal of the European Union, C 372.
Gilje, E. P., Gormley, T. A., & Levit, D. (2020). Who's paying attention? Measuring common ownership and its impact on managerial incentives. Journal of Financial Economics, 137(1), 152-178.
Grullon, G., Larkin, Y., & Michaely, R. (2019). Are US industries becoming more concentrated?. Review of Finance, 23(4), 697-743.
Gutiérrez, G., & Philippon, T. (2018). How EU markets became more competitive than US markets: A study of institutional drift (No. w24700). National Bureau of Economic Research.
Guinea, O., & Erixon, F. (2019). Standing up for competition: Market concentration, regulation, and Europe's quest for a new industrial policy (No. 01/2019). ECIPE Occasional Paper.
2 6
IMF (2019), World Economic Outlook, chapter 2. “The Rise of Corporate Market Power and its Macroeconomic Effects”
Koch, A., Panayides, M., & Thomas, S. (2021). Common ownership and competition in product markets. Journal of Financial Economics, 139(1), 109-137.
Monopolkommission. (2018). Trends in indicators of market power in Germany and Europe.
O'Brien, D. P., & Salop, S. C. (1999). Competitive effects of partial ownership: Financial interest and corporate control. Antitrust LJ, 67, 559.
Reynolds, R. J., & Snapp, B. R. (1986). The competitive effects of partial equity interests and joint ventures. International Journal of Industrial Organization, 4(2), 141-153.
Statistics Norway. (2020). Kraftig vekst i utenlandsk netthandel siden 2010. Available at:
https://www.ssb.no/utenriksokonomi/artikler-og-publikasjoner/kraftig-vekst-i-utenlandsk-netthandel-siden- 2010 (Accessed: 04.08.2021)
Stiebale, J., Suedekum, J., & Woessner, N. (2020). Robots and the rise of European superstar firms.
Valetti, T., Koltay, G., & Lorincz, S. (2019), Competition and industry concentration in Europe, Presentation at EEA (Manchester), 29th August 2019
van Heuvelen, G. H., Bettendorf, L., & Meijerink, G. (2019). Estimating markups in the Netherlands. CPB Background Document
Weche, J. P. & Wagner, J. (2020). Market power in German Manufacturing Industries in the Context of Digitization, Working paper
2 7
Appendix
Appendix A – Industry definitions
The table below provides an overview of the industries that form the basis for the industry concentrations presented in the report. The table shows which NACE codes are included in the various industries, the size of the industry and whether the industry is categorized as export or noise.
Figure 0-1 Overview of the industry classification used in the paper
Industry NACEcode
Added value 2018 in MNOK
Count 2018
Expo rt
Noi
se Reason
Wholesale trade of other
461, 4642, 46110, 46120, 46140, 46150, 46180, 46190, 46441, 46442, 46450, 46460, 46472, 46473, 46481, 46482, 46491, 46492, 46494, 46495, 46499, 46640,
46650, 46660,46691, 46693, 46694, 46710, 46720, 46733, 46739, 46740, 46750, 46769, 46900,
46389, 46390 59 004
8
990 - 1 Impricise market
Other information technology and computer service
activities 62090, 63110 3 123 561 - -
Landscape
service activities 81300 1 900 495 - -