Report TØI 1421/2015 Author(s): Nils Fearnley, Paul Pfaffenbichler, Erik Figenbaum and Reinhard Jellinek Oslo 2015, 109 pages Norwegian language. This report documents state and regional electromobility incentives across Europe with a strong emphasis on 1) battery electric vehicle (BEV) incentives and 2) Austria and Norway. The uptake and expansion of electric vehicles (e-vehicles, or electric mobility) is one way to achieve this, as proposed by, for example, the European Green Car Initiative, the EU Urban Mobility Action Plan and the strategy European alternative fuels.
European status: market shares and incentives in place
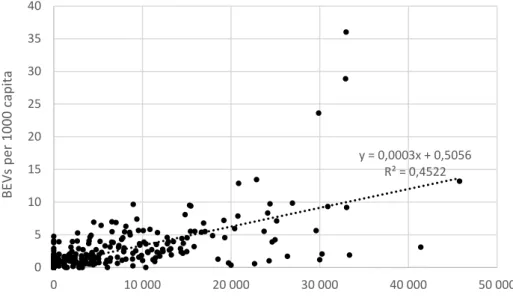
Table 2.1 shows a clear tendency for more incentives to be associated with higher EV market shares.
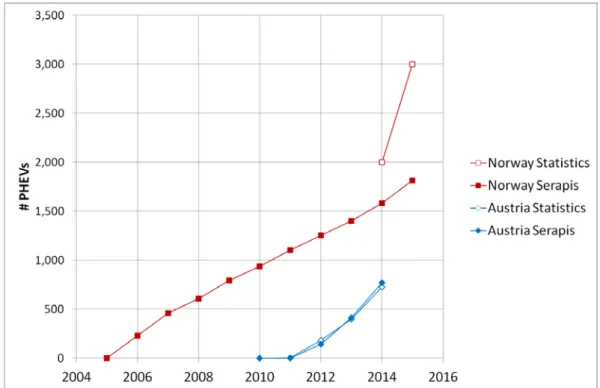
Norwegian incentives and market shares
From this, Figenbaum et al (2015) calculated the annual average economic value of the incentives for the average EV driver. The cost of the free parking incentive for municipalities may therefore exceed the value of the incentive for EV owners.

Austrian incentives and market shares
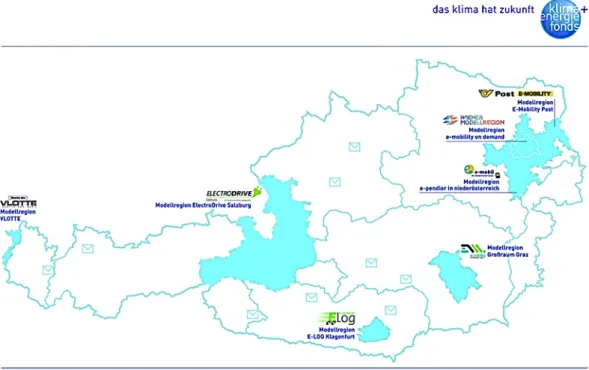
As a next step, particular attention will be paid to the connection of the different trial regions by facilitating interoperability of electric vehicles and charging stations. For all the trial regions, particular attention is paid to the integration of e-mobility and public transport, the facilitation of multimodal solutions and the interconnection of the various pilot regions to facilitate interoperability of electric vehicles and the charging infrastructure.
The quantitative model
Ui = f(Ii, Oi, Mi, D, Ri, Ti) Equation 2: General form utility of choosing a propulsion technology. The marginal utility price μP is calculated as the ratio of the price elasticity βP to the purchase price P multiplied by one minus the market share s (Equation 4).
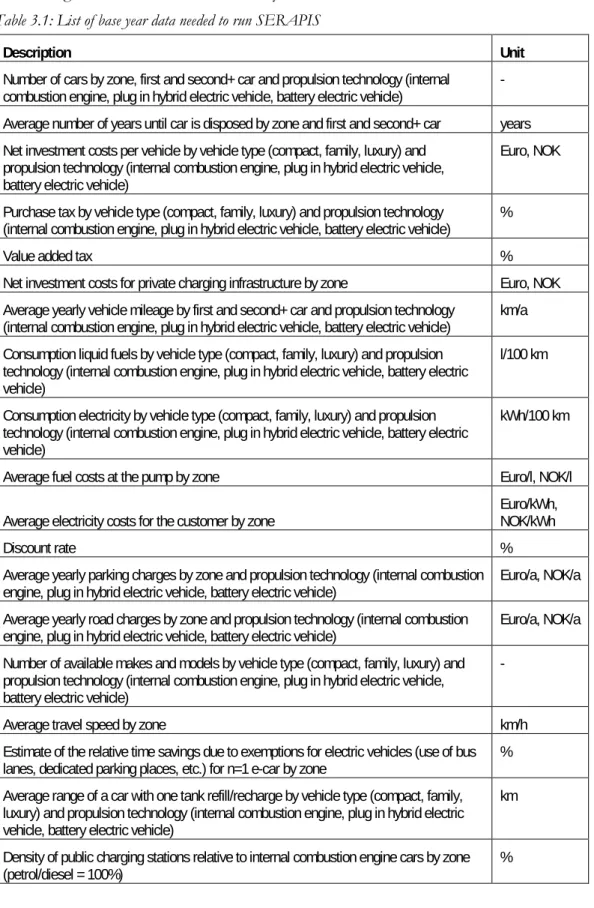
Data input and sources
Net investment costs for private charging infrastructure by zone Euro, NOK Average annual vehicle mileage by first and second+ car and propulsion technology. internal combustion engine, plug-in hybrid electric car, battery electric car) km/a Liquid fuel consumption by vehicle type (compact, family, luxury) and propulsion. Average parking charges by zone propulsion technology and year Euro/a, NOK/a Average road charges by zone propulsion technology and year Euro/a, NOK/a Annual change in the number of makes and models by car type and propulsion technology.
Calibration
Sensitivity testing and critical assumptions
Effectiveness, or target effectiveness, is a measure of the extent to which incentives achieve their objectives. Tax cost-effectiveness, on the other hand, is a measure of the extent to which objectives are achieved at the lowest possible cost.
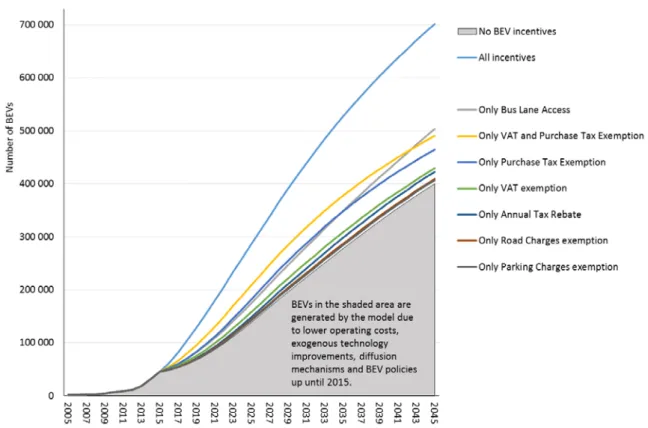
Effectiveness of Norwegian BEV incentives
At the other end of the spectrum, bus lane access appears to have the most pronounced effect. So the driven model is by no means a realistic prediction, but rather a visualization of the importance of bus lane access to BEV market inclusion.
Effectiveness of BEV incentives in Austria
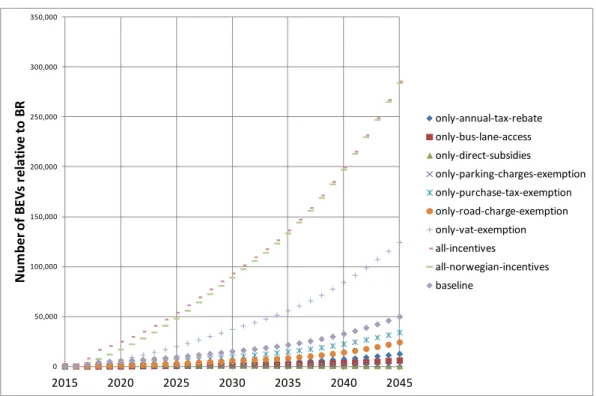
At the other end of the spectrum, the VAT exemption is the single incentive with the most pronounced effect. The possible further projection of incentives as they are currently in use in Austria (the "baseline" scenario) results in a BEV fleet of just under 200,000 vehicles in 2045. No single incentive other than the VAT exemption exceeds the likely forecast of incentives.
This is shown in Figure 4., below, where the results from Figure 4.3, above, are translated into effects related to BRA.

Comparative observations Norway and Austria
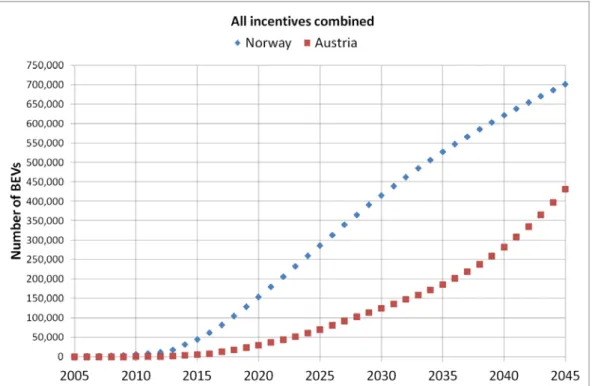
It is clear that this incentive has a very different effect, especially in the later part of the period. In Norway, the partial effect of the VAT exemption consolidates and decreases, while in Austria its effect continues to increase until the end of the forecast time horizon. It is clear that the differences to some extent reflect the fact that the BEV markets in Norway and Austria have reached quite different levels of diffusion and saturation.
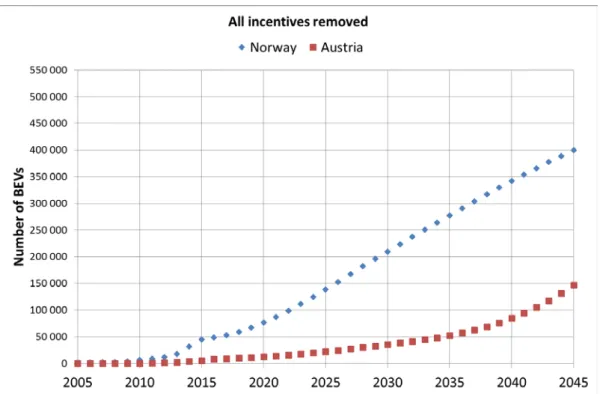
This is evident from the next Figures 4.10 and 4.11, which suggest that the Austrian BEV market is only gaining momentum, while in Norway it is approaching saturation levels.
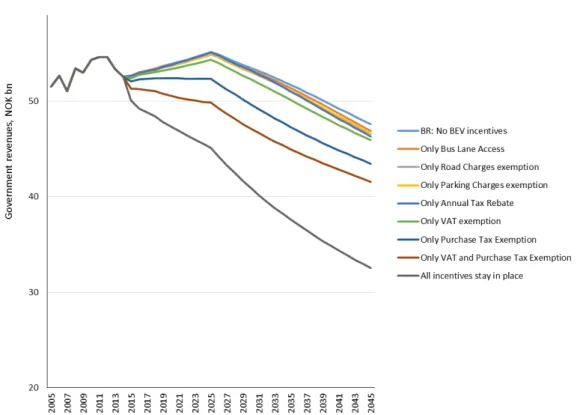
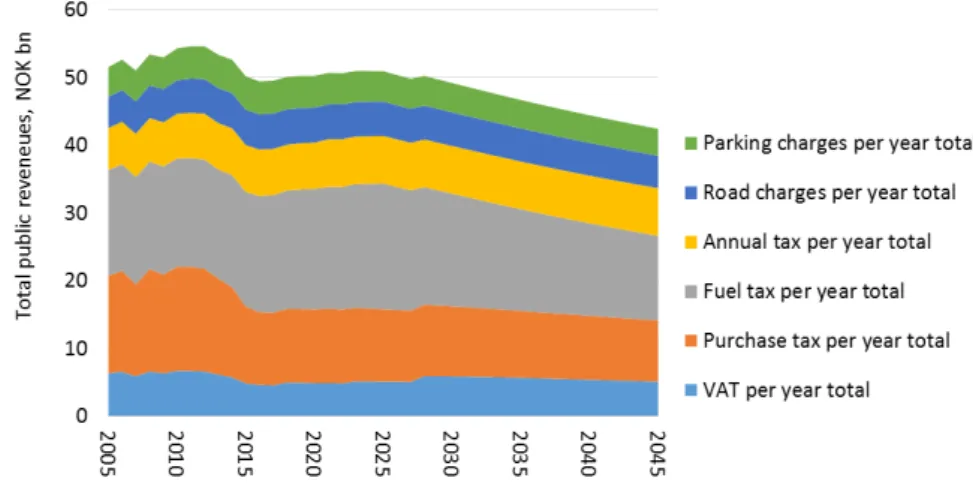
Budget implications and fiscal cost effectiveness
The most cost-effective budget policies are found below the trend line and will contribute to greater BEV sales per unit of budget cost. The rational choice would be to add more of the most cost-effective policies because they add the most BEVs at the lowest cost. Free BEV parking is the single least effective policy and, as shown above, is also among the least effective policies.
The total package of all incentives has a high cost per BEV generated for the 2020 fleet.
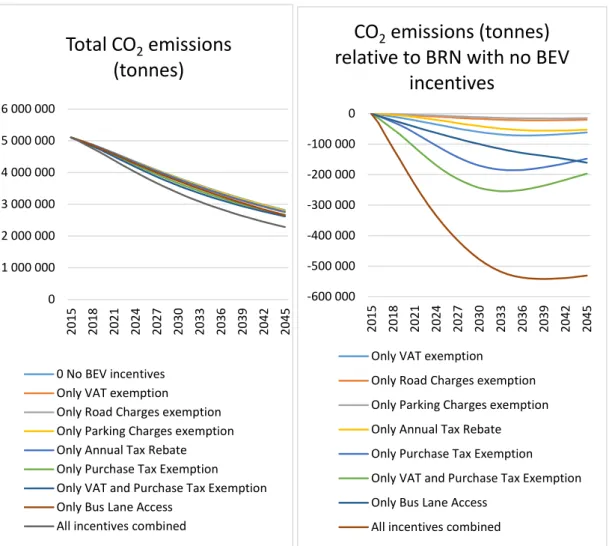
Environmental impacts of EVs incentives
Figure 4.1 shows that Base Run Norway (BRN) also generates a significant number of BEVs which. 13 Here we focus on the effect on public budgets, the main effect of which is the transfer of money into and out of public budgets. Road fee exemption only Parking fee exemption only Annual tax refund only Purchase tax exemption Only VAT and purchase tax exemption Only bus lane access.
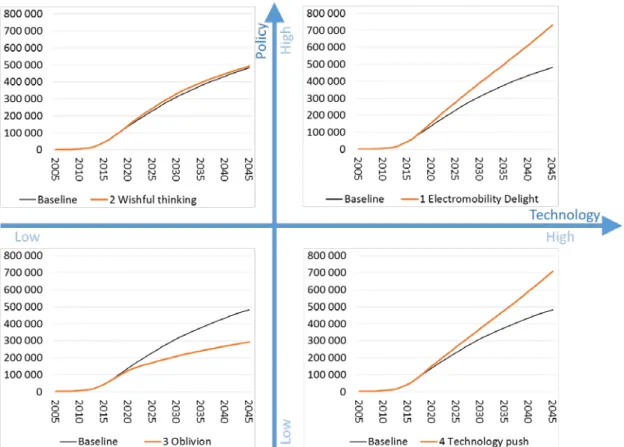
Scenario The approach recognizes uncertainty and, importantly, takes into account the possibility of rapid changes and trend breaks.
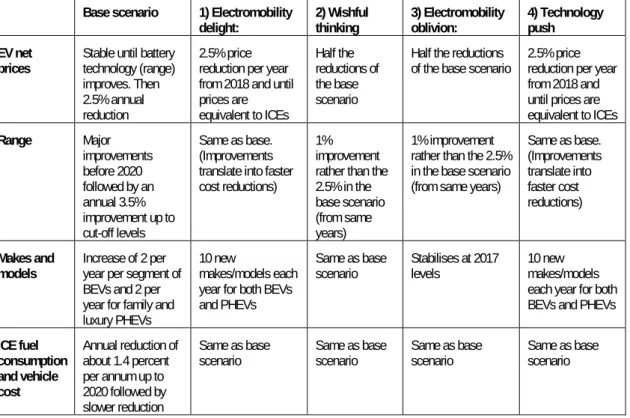
Definition of a base scenario and alternative scenarios
In Austria, BEVs are exempt from annual road tax, while PHEVs get a discount of around 25%. The luxury PHEV segment tax is expected to remain stable at 34 percent compared to 71 percent for ICEs. ICE fuel consumption is expected to decrease by around 1.4 percent per year until 2020 due to the Norwegian government's target of 85 grams of CO2 per km on average for new cars (including EVs and PHEVs) in 2020.
For example, car life expectancy is expected to increase 0.4 percent per year throughout the period, which is in line with observed historical development and expectations; while the compact car market share is assumed to remain stable at today's level and VAT levels on ICEs, PHEVs and BEVs (VAT gradually introduced in Norway) will remain as today.
Scenario definitions
The tables below explain key assumptions for the four scenarios compared to the base scenario. Half of the reductions in the base scenario. of the base scenario 2.5% price reduction per year from 2018 until prices correspond to ICE. improvements before 2020 followed by annual 3.5%. improvement up to cut-off levels. The table below explains the most important assumptions for the four scenarios compared to the base scenario.
Same as base Same as BEV and PHEV base tax set at ½ that of ICEs of the same car segment.
Scenario analysis and assessment
The Oblivion scenario will lead to an increase of about 0.4 million tonnes, while the wishful thinking scenario is more or less neutral, see figure 5.13. The results on the number of BEVs in Norway and Austria are shown in figure 5.14 below. In the baseline scenario, the number of brands and models increases linearly, but at a slow pace.
The results are affected by incentives for electric vehicles, which have been phased out since 2017 in the baseline scenario, but are still likely to be important enough to make customers in Norway choose an electric vehicle over a PHEV.
Budget balancing strategies
The annual tax is not affected as the BEV exemption is phased out in the base scenario and therefore increases annual tax revenue. This is because the total stock of passenger cars is set as constant in the SERAPIS model runs, and because the Norwegian annual tax is a fixed rate, which applies to all passenger cars. The intervention generates a marginally higher BEV stock in 2045: 486 thousand compared to 482 thousand in the base scenario.
Annual tax levels would rise by 2.5 percent annually (compared to 3.5 in the revenue-neutral exercise above).
Barriers and support for EV policies
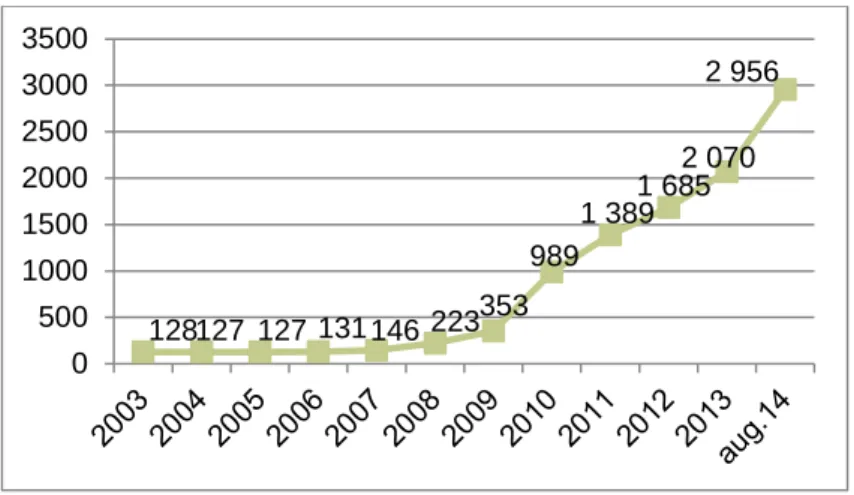
EVs have had unrestricted access to bus lanes in Norway from 2005 (Oslo area from 2003) until May 2015, utilizing spare capacity in bus lanes. Electromobility as a complete socio-technical system must be established if EVs are to succeed in the market (Figenbaum and Kolbenstvedt 2015). Nation A saves money, but will be later in developing EV-based transportation Nation B will pay most of the cost, but will move faster to an EV-based transportation sector.
Country B saves money, but will be later in the development of EV-based transportation. Country A will pay most of the costs, but is more likely to enter an electric vehicle-based transport sector.
Phasing in and phasing out incentives
BEV technology and market do not develop, costs do not fall and manufacturers can abandon the technology. The Norwegian example of successful EV policy underlines the importance of a foreseeable long-term EV policy supported by central government commitment. This gave the EV market predictable and general incentives, but also the expectation that incentives will undoubtedly be reduced or removed one day.
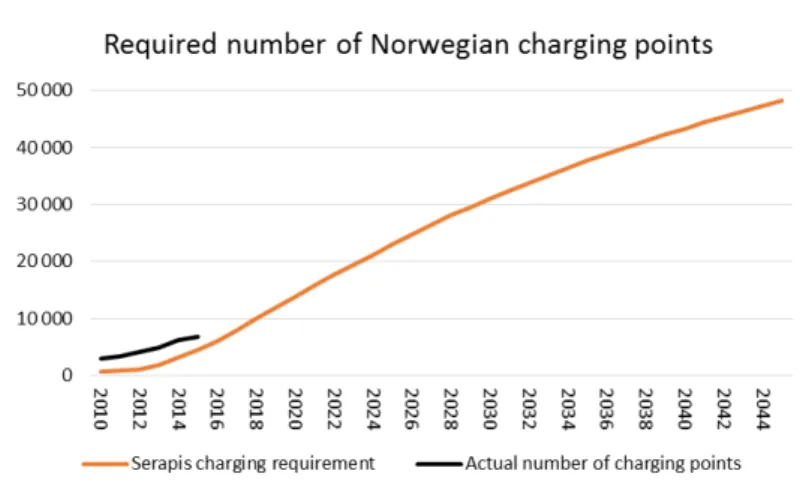
Financing charging infrastructure
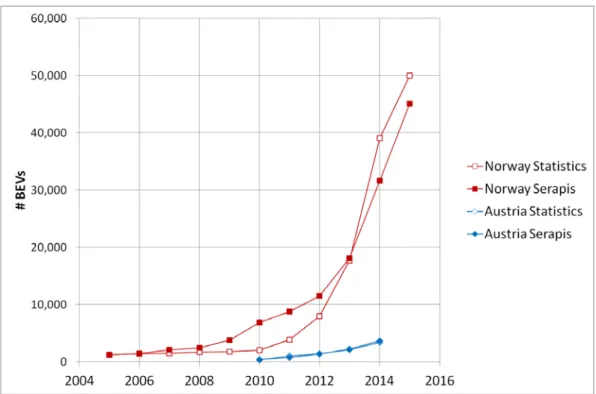
At the other end of the scale, we find "free" BEV incentives that primarily improve comfort. The Austrian EV market has evolved in a similar way to Norway, but the size of the Norwegian market is significantly larger - by a factor of about 10. The differentiated use of incentives and our surveys of EV users show an important aspect of Norwegian success.
Directive 2014/94/EU of the European Parliament and of the Council of 22 October 2014 on the deployment of infrastructure for alternative fuels (Text with EEA relevance).
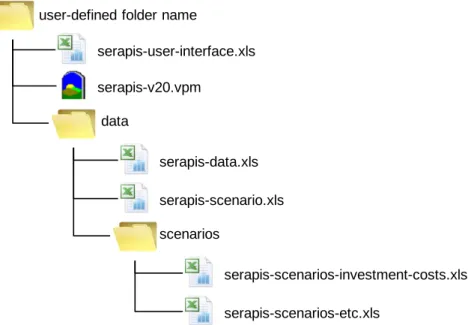
The SERAPIS v2.0 software
Opening the file “serapis-v20.vpm” using the Vensim Model Reader® shows the “user interface” view (Figure A.5). The diagram in the center of the view shows the development of the battery electric car fleet. Since the user is able to investigate all relationships of the model in a qualitative and quantitative way, SERAPIS v2.0 qualifies as a white box model.
The control panel (Figure A.12) can be used to change the start and end time of the simulation (Figure A.13) and load/unload data from previously calculated scenarios (Figure A.14).
Sensitivity testing of Serapis calibration and assumptions
The figure below shows how the result changes when each of them is reduced by ½. We see that the elasticity assumptions for the compact car and luxury car segments have a very large effect on the result. In the figure below, the cost of liquid fuel (gasoline and diesel) has increased by 50%.
It appears from the figure below that the supply side is important and has visible effects on the model's results.
Tobit model output (EasyReg software)